French vs Immigrants from South Eastern Asia Female Poverty
COMPARE
French
Immigrants from South Eastern Asia
Female Poverty
Female Poverty Comparison
French
Immigrants from South Eastern Asia
12.9%
FEMALE POVERTY
85.6/ 100
METRIC RATING
135th/ 347
METRIC RANK
12.7%
FEMALE POVERTY
89.9/ 100
METRIC RATING
123rd/ 347
METRIC RANK
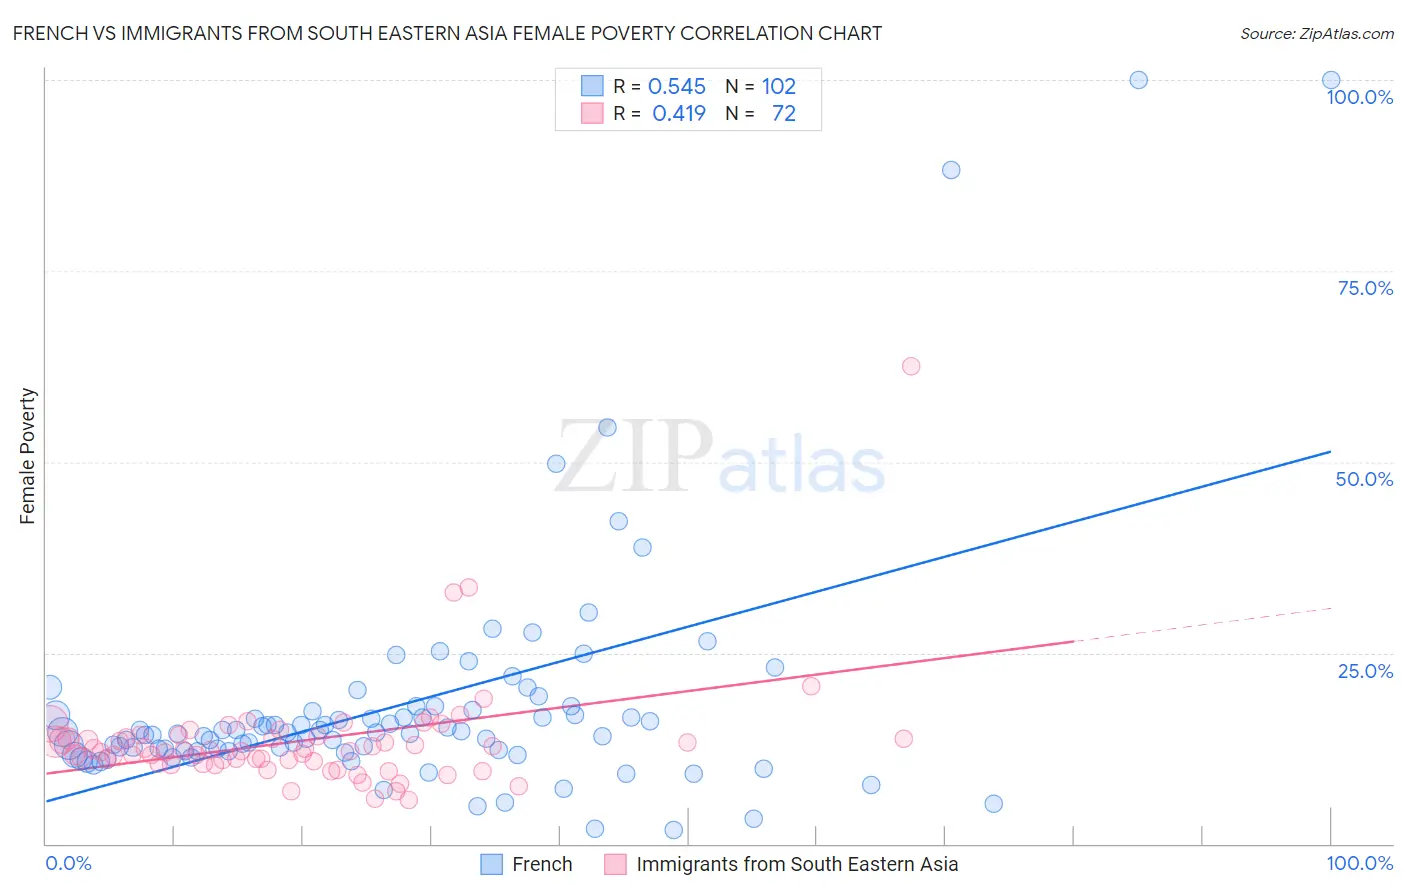
French vs Immigrants from South Eastern Asia Female Poverty Correlation Chart
The statistical analysis conducted on geographies consisting of 571,140,753 people shows a substantial positive correlation between the proportion of French and poverty level among females in the United States with a correlation coefficient (R) of 0.545 and weighted average of 12.9%. Similarly, the statistical analysis conducted on geographies consisting of 512,071,275 people shows a moderate positive correlation between the proportion of Immigrants from South Eastern Asia and poverty level among females in the United States with a correlation coefficient (R) of 0.419 and weighted average of 12.7%, a difference of 1.0%.
Female Poverty Correlation Summary
| Measurement | French | Immigrants from South Eastern Asia |
| Minimum | 1.8% | 5.8% |
| Maximum | 100.0% | 62.5% |
| Range | 98.2% | 56.7% |
| Mean | 18.1% | 13.4% |
| Median | 14.5% | 12.2% |
| Interquartile 25% (IQ1) | 12.1% | 10.6% |
| Interquartile 75% (IQ3) | 17.4% | 14.0% |
| Interquartile Range (IQR) | 5.3% | 3.4% |
| Standard Deviation (Sample) | 15.9% | 7.4% |
| Standard Deviation (Population) | 15.8% | 7.3% |
Demographics Similar to French and Immigrants from South Eastern Asia by Female Poverty
In terms of female poverty, the demographic groups most similar to French are Immigrants from Switzerland (12.9%, a difference of 0.050%), Peruvian (12.9%, a difference of 0.080%), Chilean (12.9%, a difference of 0.17%), Immigrants from Western Europe (12.8%, a difference of 0.22%), and Immigrants from Jordan (12.8%, a difference of 0.28%). Similarly, the demographic groups most similar to Immigrants from South Eastern Asia are French Canadian (12.7%, a difference of 0.070%), Immigrants from Hungary (12.7%, a difference of 0.10%), Immigrants from Norway (12.8%, a difference of 0.18%), New Zealander (12.7%, a difference of 0.21%), and Argentinean (12.8%, a difference of 0.23%).
| Demographics | Rating | Rank | Female Poverty |
| Albanians | 90.8 /100 | #119 | Exceptional 12.7% |
| New Zealanders | 90.6 /100 | #120 | Exceptional 12.7% |
| Immigrants | Hungary | 90.3 /100 | #121 | Exceptional 12.7% |
| French Canadians | 90.2 /100 | #122 | Exceptional 12.7% |
| Immigrants | South Eastern Asia | 89.9 /100 | #123 | Excellent 12.7% |
| Immigrants | Norway | 89.3 /100 | #124 | Excellent 12.8% |
| Argentineans | 89.1 /100 | #125 | Excellent 12.8% |
| Immigrants | Ukraine | 88.8 /100 | #126 | Excellent 12.8% |
| South Africans | 88.4 /100 | #127 | Excellent 12.8% |
| Immigrants | Belarus | 88.2 /100 | #128 | Excellent 12.8% |
| Immigrants | Brazil | 87.9 /100 | #129 | Excellent 12.8% |
| Immigrants | Vietnam | 87.1 /100 | #130 | Excellent 12.8% |
| Immigrants | Argentina | 87.0 /100 | #131 | Excellent 12.8% |
| Immigrants | Jordan | 86.9 /100 | #132 | Excellent 12.8% |
| Immigrants | Western Europe | 86.6 /100 | #133 | Excellent 12.8% |
| Immigrants | Switzerland | 85.8 /100 | #134 | Excellent 12.9% |
| French | 85.6 /100 | #135 | Excellent 12.9% |
| Peruvians | 85.2 /100 | #136 | Excellent 12.9% |
| Chileans | 84.7 /100 | #137 | Excellent 12.9% |
| Immigrants | France | 83.6 /100 | #138 | Excellent 12.9% |
| Basques | 83.1 /100 | #139 | Excellent 12.9% |