French vs Ethiopian Female Poverty
COMPARE
French
Ethiopian
Female Poverty
Female Poverty Comparison
French
Ethiopians
12.9%
FEMALE POVERTY
85.6/ 100
METRIC RATING
135th/ 347
METRIC RANK
13.3%
FEMALE POVERTY
62.3/ 100
METRIC RATING
164th/ 347
METRIC RANK
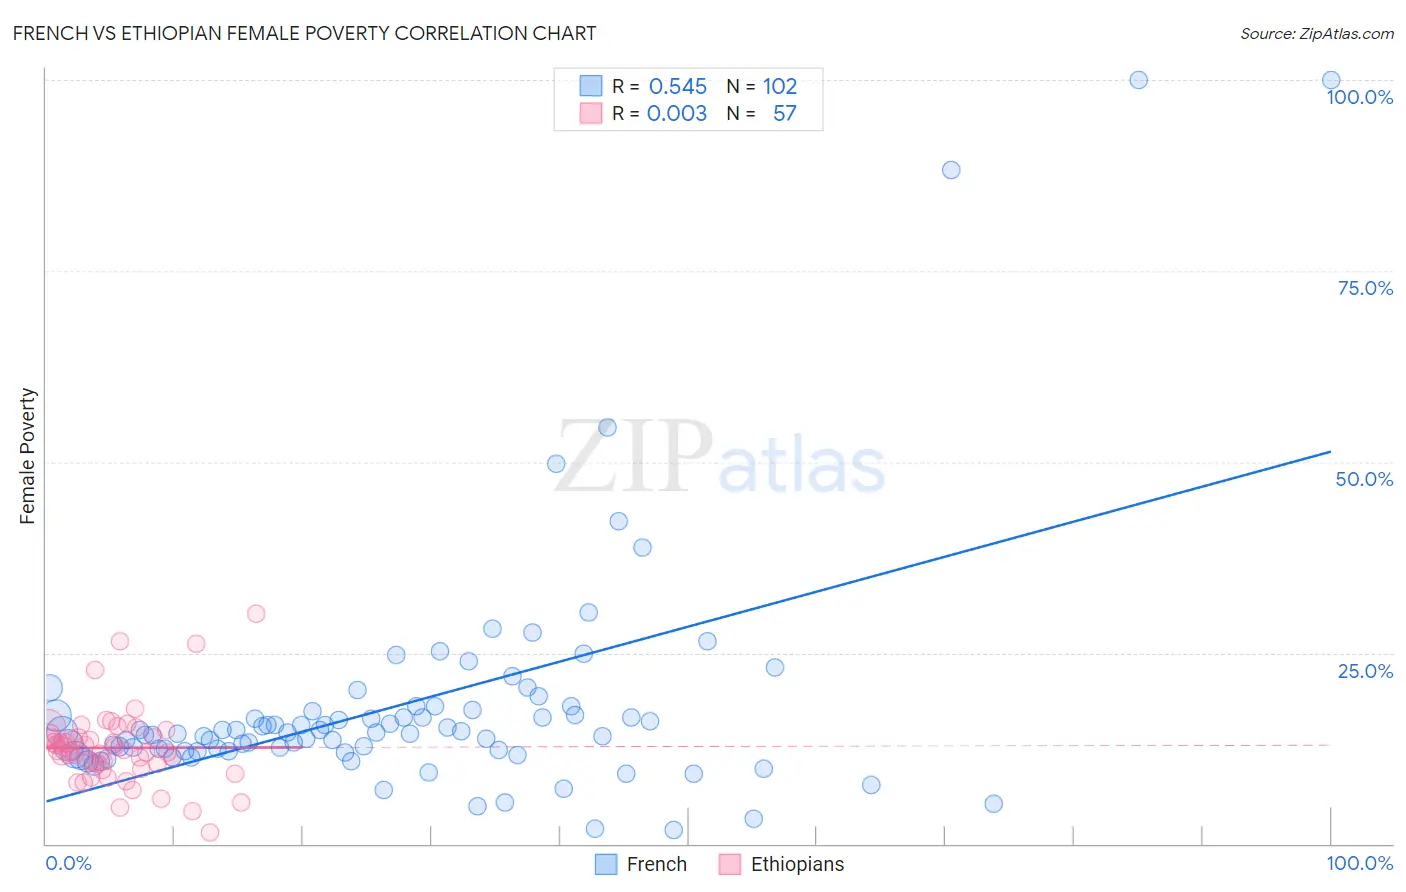
French vs Ethiopian Female Poverty Correlation Chart
The statistical analysis conducted on geographies consisting of 571,140,753 people shows a substantial positive correlation between the proportion of French and poverty level among females in the United States with a correlation coefficient (R) of 0.545 and weighted average of 12.9%. Similarly, the statistical analysis conducted on geographies consisting of 223,083,750 people shows no correlation between the proportion of Ethiopians and poverty level among females in the United States with a correlation coefficient (R) of 0.003 and weighted average of 13.3%, a difference of 3.2%.
Female Poverty Correlation Summary
| Measurement | French | Ethiopian |
| Minimum | 1.8% | 1.5% |
| Maximum | 100.0% | 30.1% |
| Range | 98.2% | 28.6% |
| Mean | 18.1% | 12.6% |
| Median | 14.5% | 12.2% |
| Interquartile 25% (IQ1) | 12.1% | 10.1% |
| Interquartile 75% (IQ3) | 17.4% | 14.1% |
| Interquartile Range (IQR) | 5.3% | 4.0% |
| Standard Deviation (Sample) | 15.9% | 5.0% |
| Standard Deviation (Population) | 15.8% | 5.0% |
Similar Demographics by Female Poverty
Demographics Similar to French by Female Poverty
In terms of female poverty, the demographic groups most similar to French are Immigrants from Switzerland (12.9%, a difference of 0.050%), Peruvian (12.9%, a difference of 0.080%), Chilean (12.9%, a difference of 0.17%), Immigrants from Western Europe (12.8%, a difference of 0.22%), and Immigrants from Jordan (12.8%, a difference of 0.28%).
| Demographics | Rating | Rank | Female Poverty |
| Immigrants | Belarus | 88.2 /100 | #128 | Excellent 12.8% |
| Immigrants | Brazil | 87.9 /100 | #129 | Excellent 12.8% |
| Immigrants | Vietnam | 87.1 /100 | #130 | Excellent 12.8% |
| Immigrants | Argentina | 87.0 /100 | #131 | Excellent 12.8% |
| Immigrants | Jordan | 86.9 /100 | #132 | Excellent 12.8% |
| Immigrants | Western Europe | 86.6 /100 | #133 | Excellent 12.8% |
| Immigrants | Switzerland | 85.8 /100 | #134 | Excellent 12.9% |
| French | 85.6 /100 | #135 | Excellent 12.9% |
| Peruvians | 85.2 /100 | #136 | Excellent 12.9% |
| Chileans | 84.7 /100 | #137 | Excellent 12.9% |
| Immigrants | France | 83.6 /100 | #138 | Excellent 12.9% |
| Basques | 83.1 /100 | #139 | Excellent 12.9% |
| Pakistanis | 83.0 /100 | #140 | Excellent 12.9% |
| Icelanders | 81.1 /100 | #141 | Excellent 13.0% |
| Brazilians | 80.5 /100 | #142 | Excellent 13.0% |
Demographics Similar to Ethiopians by Female Poverty
In terms of female poverty, the demographic groups most similar to Ethiopians are Guamanian/Chamorro (13.3%, a difference of 0.010%), Immigrants from Albania (13.3%, a difference of 0.010%), Immigrants from Ethiopia (13.3%, a difference of 0.020%), Scotch-Irish (13.3%, a difference of 0.020%), and Immigrants from Nepal (13.3%, a difference of 0.050%).
| Demographics | Rating | Rank | Female Poverty |
| Immigrants | Northern Africa | 68.8 /100 | #157 | Good 13.2% |
| Pennsylvania Germans | 67.3 /100 | #158 | Good 13.2% |
| Costa Ricans | 63.6 /100 | #159 | Good 13.3% |
| Immigrants | Nepal | 62.7 /100 | #160 | Good 13.3% |
| Immigrants | Ethiopia | 62.5 /100 | #161 | Good 13.3% |
| Guamanians/Chamorros | 62.4 /100 | #162 | Good 13.3% |
| Immigrants | Albania | 62.4 /100 | #163 | Good 13.3% |
| Ethiopians | 62.3 /100 | #164 | Good 13.3% |
| Scotch-Irish | 62.1 /100 | #165 | Good 13.3% |
| Immigrants | Oceania | 59.7 /100 | #166 | Average 13.3% |
| Immigrants | Chile | 57.4 /100 | #167 | Average 13.3% |
| Aleuts | 56.7 /100 | #168 | Average 13.4% |
| Lebanese | 55.9 /100 | #169 | Average 13.4% |
| Colombians | 55.7 /100 | #170 | Average 13.4% |
| Whites/Caucasians | 54.6 /100 | #171 | Average 13.4% |