French vs Immigrants from Africa Female Poverty
COMPARE
French
Immigrants from Africa
Female Poverty
Female Poverty Comparison
French
Immigrants from Africa
12.9%
FEMALE POVERTY
85.6/ 100
METRIC RATING
135th/ 347
METRIC RANK
14.5%
FEMALE POVERTY
3.3/ 100
METRIC RATING
223rd/ 347
METRIC RANK
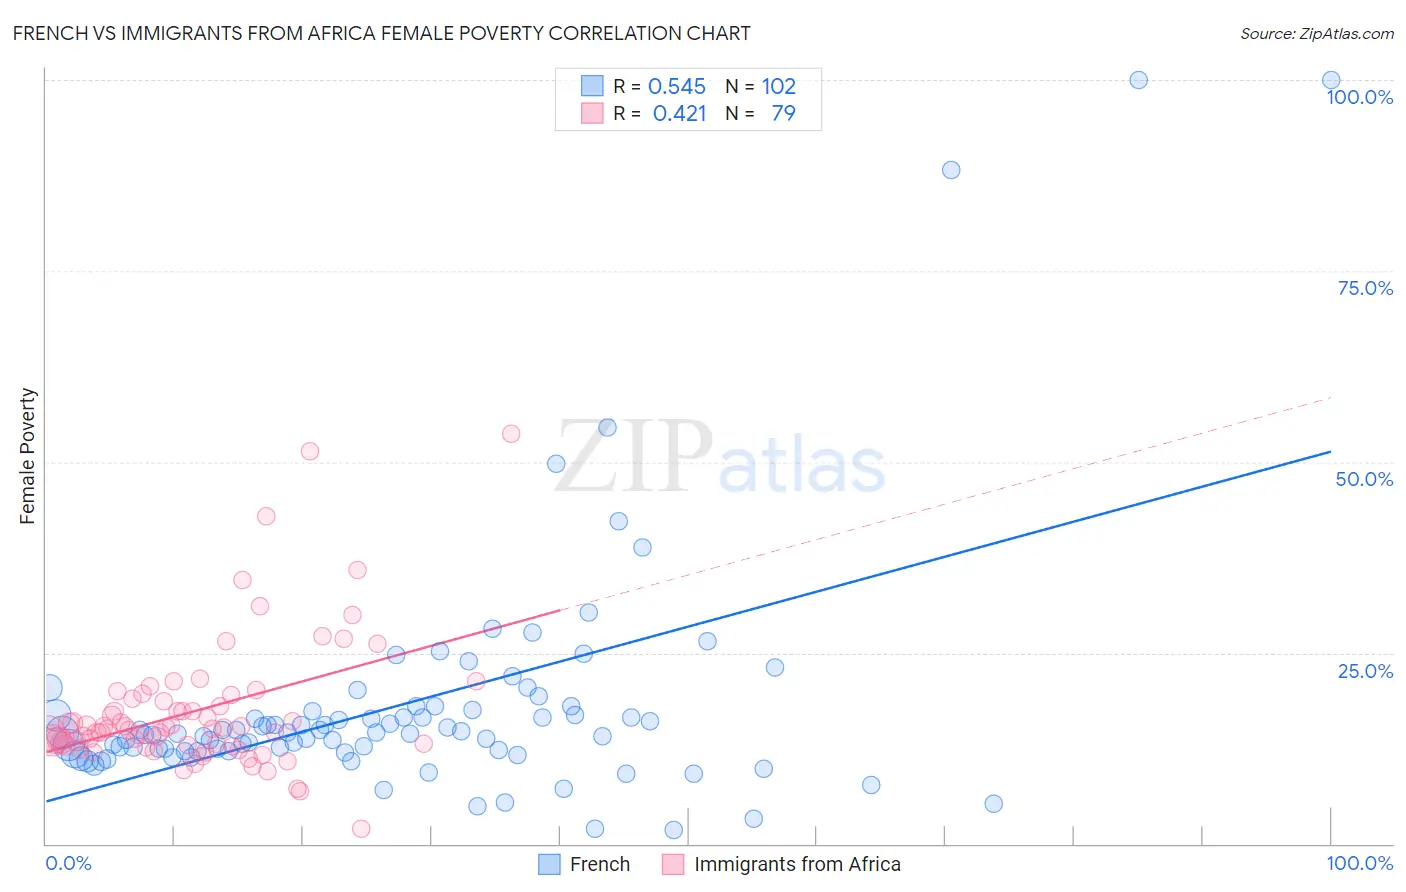
French vs Immigrants from Africa Female Poverty Correlation Chart
The statistical analysis conducted on geographies consisting of 571,140,753 people shows a substantial positive correlation between the proportion of French and poverty level among females in the United States with a correlation coefficient (R) of 0.545 and weighted average of 12.9%. Similarly, the statistical analysis conducted on geographies consisting of 468,810,644 people shows a moderate positive correlation between the proportion of Immigrants from Africa and poverty level among females in the United States with a correlation coefficient (R) of 0.421 and weighted average of 14.5%, a difference of 13.0%.
Female Poverty Correlation Summary
| Measurement | French | Immigrants from Africa |
| Minimum | 1.8% | 1.9% |
| Maximum | 100.0% | 53.6% |
| Range | 98.2% | 51.7% |
| Mean | 18.1% | 17.4% |
| Median | 14.5% | 15.1% |
| Interquartile 25% (IQ1) | 12.1% | 12.9% |
| Interquartile 75% (IQ3) | 17.4% | 19.0% |
| Interquartile Range (IQR) | 5.3% | 6.1% |
| Standard Deviation (Sample) | 15.9% | 8.7% |
| Standard Deviation (Population) | 15.8% | 8.6% |
Similar Demographics by Female Poverty
Demographics Similar to French by Female Poverty
In terms of female poverty, the demographic groups most similar to French are Immigrants from Switzerland (12.9%, a difference of 0.050%), Peruvian (12.9%, a difference of 0.080%), Chilean (12.9%, a difference of 0.17%), Immigrants from Western Europe (12.8%, a difference of 0.22%), and Immigrants from Jordan (12.8%, a difference of 0.28%).
| Demographics | Rating | Rank | Female Poverty |
| Immigrants | Belarus | 88.2 /100 | #128 | Excellent 12.8% |
| Immigrants | Brazil | 87.9 /100 | #129 | Excellent 12.8% |
| Immigrants | Vietnam | 87.1 /100 | #130 | Excellent 12.8% |
| Immigrants | Argentina | 87.0 /100 | #131 | Excellent 12.8% |
| Immigrants | Jordan | 86.9 /100 | #132 | Excellent 12.8% |
| Immigrants | Western Europe | 86.6 /100 | #133 | Excellent 12.8% |
| Immigrants | Switzerland | 85.8 /100 | #134 | Excellent 12.9% |
| French | 85.6 /100 | #135 | Excellent 12.9% |
| Peruvians | 85.2 /100 | #136 | Excellent 12.9% |
| Chileans | 84.7 /100 | #137 | Excellent 12.9% |
| Immigrants | France | 83.6 /100 | #138 | Excellent 12.9% |
| Basques | 83.1 /100 | #139 | Excellent 12.9% |
| Pakistanis | 83.0 /100 | #140 | Excellent 12.9% |
| Icelanders | 81.1 /100 | #141 | Excellent 13.0% |
| Brazilians | 80.5 /100 | #142 | Excellent 13.0% |
Demographics Similar to Immigrants from Africa by Female Poverty
In terms of female poverty, the demographic groups most similar to Immigrants from Africa are Nonimmigrants (14.5%, a difference of 0.23%), Immigrants from Cambodia (14.5%, a difference of 0.26%), American (14.6%, a difference of 0.39%), Immigrants from Micronesia (14.6%, a difference of 0.40%), and Alsatian (14.5%, a difference of 0.45%).
| Demographics | Rating | Rank | Female Poverty |
| Immigrants | Thailand | 4.5 /100 | #216 | Tragic 14.4% |
| Immigrants | Immigrants | 4.5 /100 | #217 | Tragic 14.4% |
| Immigrants | Uzbekistan | 4.4 /100 | #218 | Tragic 14.4% |
| Japanese | 4.1 /100 | #219 | Tragic 14.5% |
| Alsatians | 4.0 /100 | #220 | Tragic 14.5% |
| Immigrants | Cambodia | 3.7 /100 | #221 | Tragic 14.5% |
| Immigrants | Nonimmigrants | 3.7 /100 | #222 | Tragic 14.5% |
| Immigrants | Africa | 3.3 /100 | #223 | Tragic 14.5% |
| Americans | 2.8 /100 | #224 | Tragic 14.6% |
| Immigrants | Micronesia | 2.8 /100 | #225 | Tragic 14.6% |
| Immigrants | Eritrea | 2.4 /100 | #226 | Tragic 14.6% |
| Immigrants | Nigeria | 2.1 /100 | #227 | Tragic 14.7% |
| German Russians | 2.0 /100 | #228 | Tragic 14.7% |
| Ghanaians | 1.9 /100 | #229 | Tragic 14.7% |
| Alaska Natives | 1.8 /100 | #230 | Tragic 14.7% |