Ghanaian vs Kiowa Married-Couple Family Poverty
COMPARE
Ghanaian
Kiowa
Married-Couple Family Poverty
Married-Couple Family Poverty Comparison
Ghanaians
Kiowa
5.7%
MARRIED-COUPLE FAMILY POVERTY
3.3/ 100
METRIC RATING
236th/ 347
METRIC RANK
6.6%
MARRIED-COUPLE FAMILY POVERTY
0.0/ 100
METRIC RATING
297th/ 347
METRIC RANK
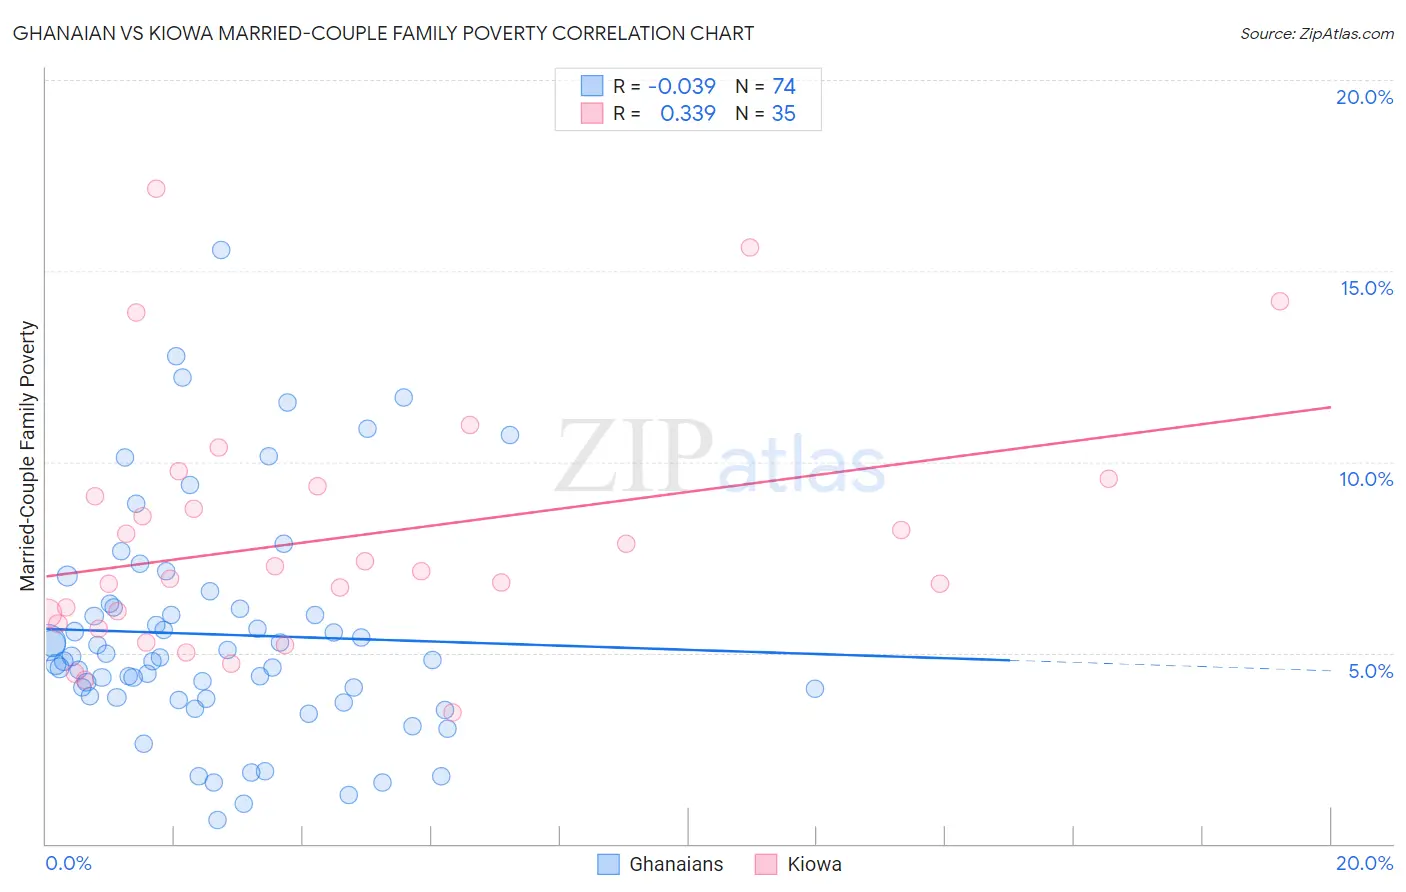
Ghanaian vs Kiowa Married-Couple Family Poverty Correlation Chart
The statistical analysis conducted on geographies consisting of 189,762,764 people shows no correlation between the proportion of Ghanaians and poverty level among married-couple families in the United States with a correlation coefficient (R) of -0.039 and weighted average of 5.7%. Similarly, the statistical analysis conducted on geographies consisting of 56,003,088 people shows a mild positive correlation between the proportion of Kiowa and poverty level among married-couple families in the United States with a correlation coefficient (R) of 0.339 and weighted average of 6.6%, a difference of 16.0%.
Married-Couple Family Poverty Correlation Summary
| Measurement | Ghanaian | Kiowa |
| Minimum | 0.61% | 3.4% |
| Maximum | 15.5% | 17.1% |
| Range | 14.9% | 13.7% |
| Mean | 5.5% | 8.0% |
| Median | 4.8% | 7.1% |
| Interquartile 25% (IQ1) | 3.8% | 5.8% |
| Interquartile 75% (IQ3) | 6.2% | 9.4% |
| Interquartile Range (IQR) | 2.4% | 3.6% |
| Standard Deviation (Sample) | 3.0% | 3.2% |
| Standard Deviation (Population) | 2.9% | 3.2% |
Similar Demographics by Married-Couple Family Poverty
Demographics Similar to Ghanaians by Married-Couple Family Poverty
In terms of married-couple family poverty, the demographic groups most similar to Ghanaians are Immigrants from Sudan (5.7%, a difference of 0.16%), Immigrants from South America (5.7%, a difference of 0.16%), Immigrants from Colombia (5.7%, a difference of 0.35%), Immigrants from Uruguay (5.7%, a difference of 0.35%), and Cherokee (5.8%, a difference of 0.53%).
| Demographics | Rating | Rank | Married-Couple Family Poverty |
| Sub-Saharan Africans | 4.9 /100 | #229 | Tragic 5.7% |
| Moroccans | 4.9 /100 | #230 | Tragic 5.7% |
| Immigrants | Iraq | 4.4 /100 | #231 | Tragic 5.7% |
| Immigrants | Laos | 4.4 /100 | #232 | Tragic 5.7% |
| Immigrants | Colombia | 3.7 /100 | #233 | Tragic 5.7% |
| Immigrants | Uruguay | 3.7 /100 | #234 | Tragic 5.7% |
| Immigrants | Sudan | 3.5 /100 | #235 | Tragic 5.7% |
| Ghanaians | 3.3 /100 | #236 | Tragic 5.7% |
| Immigrants | South America | 3.1 /100 | #237 | Tragic 5.7% |
| Cherokee | 2.7 /100 | #238 | Tragic 5.8% |
| Venezuelans | 2.7 /100 | #239 | Tragic 5.8% |
| Fijians | 2.5 /100 | #240 | Tragic 5.8% |
| Immigrants | Panama | 2.5 /100 | #241 | Tragic 5.8% |
| Immigrants | Western Africa | 2.4 /100 | #242 | Tragic 5.8% |
| Somalis | 2.3 /100 | #243 | Tragic 5.8% |
Demographics Similar to Kiowa by Married-Couple Family Poverty
In terms of married-couple family poverty, the demographic groups most similar to Kiowa are U.S. Virgin Islander (6.6%, a difference of 0.010%), Immigrants from Guyana (6.7%, a difference of 0.070%), Immigrants from Uzbekistan (6.6%, a difference of 0.11%), Bahamian (6.6%, a difference of 0.40%), and Nicaraguan (6.7%, a difference of 0.61%).
| Demographics | Rating | Rank | Married-Couple Family Poverty |
| Immigrants | Barbados | 0.0 /100 | #290 | Tragic 6.5% |
| Belizeans | 0.0 /100 | #291 | Tragic 6.5% |
| Immigrants | Lebanon | 0.0 /100 | #292 | Tragic 6.6% |
| Arapaho | 0.0 /100 | #293 | Tragic 6.6% |
| Bahamians | 0.0 /100 | #294 | Tragic 6.6% |
| Immigrants | Uzbekistan | 0.0 /100 | #295 | Tragic 6.6% |
| U.S. Virgin Islanders | 0.0 /100 | #296 | Tragic 6.6% |
| Kiowa | 0.0 /100 | #297 | Tragic 6.6% |
| Immigrants | Guyana | 0.0 /100 | #298 | Tragic 6.7% |
| Nicaraguans | 0.0 /100 | #299 | Tragic 6.7% |
| Immigrants | Belize | 0.0 /100 | #300 | Tragic 6.7% |
| Central Americans | 0.0 /100 | #301 | Tragic 6.7% |
| Immigrants | Ecuador | 0.0 /100 | #302 | Tragic 6.7% |
| Immigrants | El Salvador | 0.0 /100 | #303 | Tragic 6.8% |
| Cubans | 0.0 /100 | #304 | Tragic 6.8% |