Ethiopian vs Menominee Child Poverty Under the Age of 5
COMPARE
Ethiopian
Menominee
Child Poverty Under the Age of 5
Child Poverty Under the Age of 5 Comparison
Ethiopians
Menominee
16.5%
CHILD POVERTY UNDER THE AGE OF 5
82.7/ 100
METRIC RATING
144th/ 347
METRIC RANK
23.3%
CHILD POVERTY UNDER THE AGE OF 5
0.0/ 100
METRIC RATING
317th/ 347
METRIC RANK
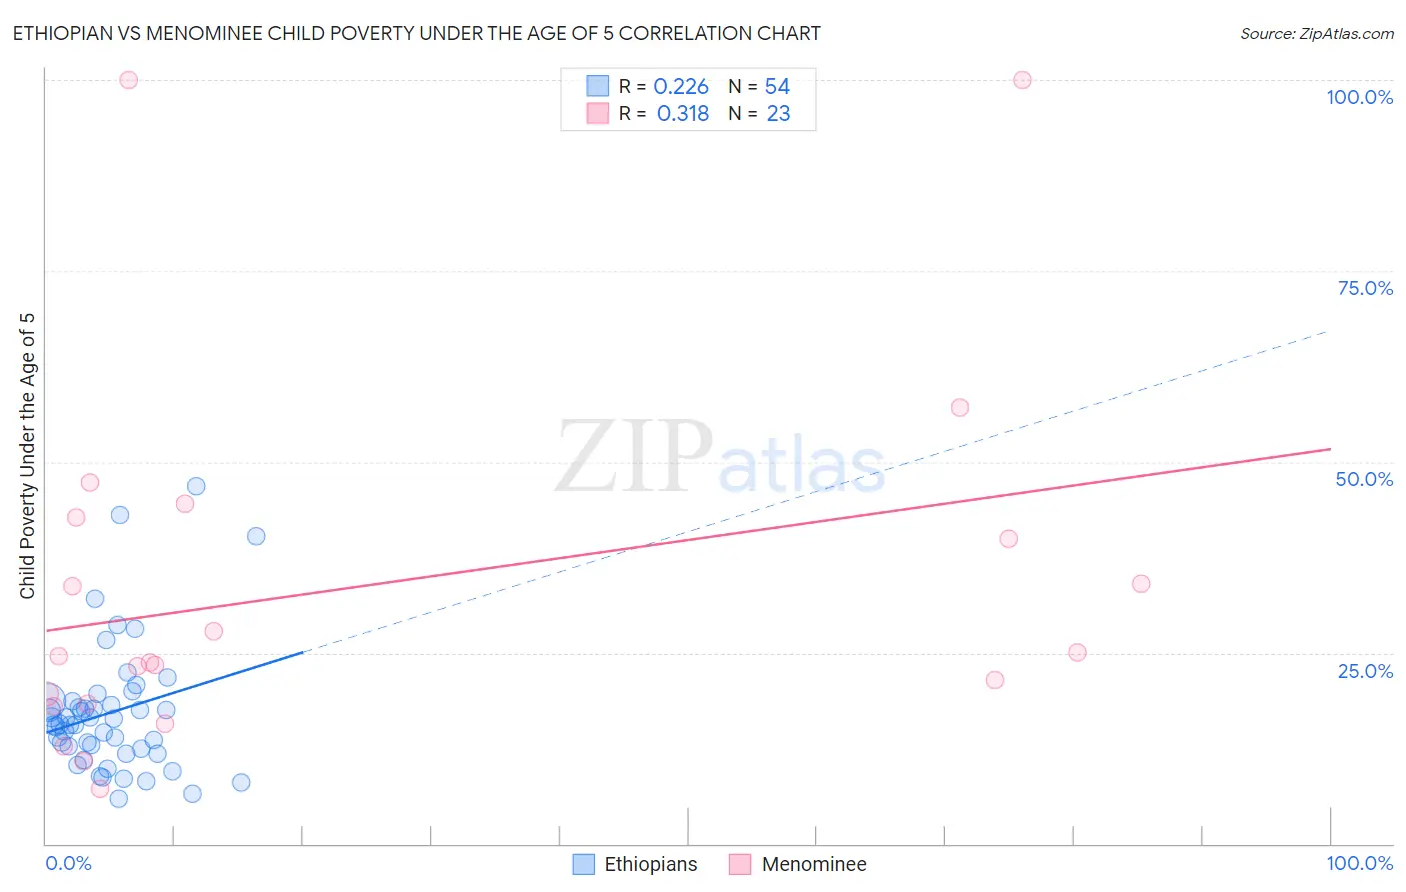
Ethiopian vs Menominee Child Poverty Under the Age of 5 Correlation Chart
The statistical analysis conducted on geographies consisting of 218,832,621 people shows a weak positive correlation between the proportion of Ethiopians and poverty level among children under the age of 5 in the United States with a correlation coefficient (R) of 0.226 and weighted average of 16.5%. Similarly, the statistical analysis conducted on geographies consisting of 45,389,615 people shows a mild positive correlation between the proportion of Menominee and poverty level among children under the age of 5 in the United States with a correlation coefficient (R) of 0.318 and weighted average of 23.3%, a difference of 40.7%.
Child Poverty Under the Age of 5 Correlation Summary
| Measurement | Ethiopian | Menominee |
| Minimum | 5.9% | 7.1% |
| Maximum | 46.8% | 100.0% |
| Range | 40.9% | 92.9% |
| Mean | 17.2% | 33.5% |
| Median | 15.6% | 24.6% |
| Interquartile 25% (IQ1) | 12.5% | 18.4% |
| Interquartile 75% (IQ3) | 18.6% | 42.7% |
| Interquartile Range (IQR) | 6.2% | 24.3% |
| Standard Deviation (Sample) | 8.4% | 24.4% |
| Standard Deviation (Population) | 8.4% | 23.9% |
Similar Demographics by Child Poverty Under the Age of 5
Demographics Similar to Ethiopians by Child Poverty Under the Age of 5
In terms of child poverty under the age of 5, the demographic groups most similar to Ethiopians are Samoan (16.5%, a difference of 0.060%), Portuguese (16.5%, a difference of 0.070%), Immigrants from Western Europe (16.5%, a difference of 0.11%), Immigrants from Ethiopia (16.6%, a difference of 0.11%), and Israeli (16.6%, a difference of 0.12%).
| Demographics | Rating | Rank | Child Poverty Under the Age of 5 |
| Immigrants | Chile | 85.3 /100 | #137 | Excellent 16.4% |
| Germans | 84.8 /100 | #138 | Excellent 16.5% |
| Immigrants | Hungary | 84.5 /100 | #139 | Excellent 16.5% |
| Guamanians/Chamorros | 84.2 /100 | #140 | Excellent 16.5% |
| Immigrants | Western Europe | 83.3 /100 | #141 | Excellent 16.5% |
| Portuguese | 83.0 /100 | #142 | Excellent 16.5% |
| Samoans | 83.0 /100 | #143 | Excellent 16.5% |
| Ethiopians | 82.7 /100 | #144 | Excellent 16.5% |
| Immigrants | Ethiopia | 82.1 /100 | #145 | Excellent 16.6% |
| Israelis | 82.0 /100 | #146 | Excellent 16.6% |
| Immigrants | Nepal | 80.3 /100 | #147 | Excellent 16.6% |
| Syrians | 79.1 /100 | #148 | Good 16.6% |
| New Zealanders | 78.7 /100 | #149 | Good 16.6% |
| Colombians | 77.8 /100 | #150 | Good 16.7% |
| Canadians | 77.6 /100 | #151 | Good 16.7% |
Demographics Similar to Menominee by Child Poverty Under the Age of 5
In terms of child poverty under the age of 5, the demographic groups most similar to Menominee are Dutch West Indian (23.3%, a difference of 0.10%), Yakama (23.1%, a difference of 0.50%), Chippewa (23.4%, a difference of 0.58%), Arapaho (23.1%, a difference of 0.62%), and Choctaw (23.5%, a difference of 0.96%).
| Demographics | Rating | Rank | Child Poverty Under the Age of 5 |
| Africans | 0.0 /100 | #310 | Tragic 22.8% |
| Seminole | 0.0 /100 | #311 | Tragic 22.8% |
| Hondurans | 0.0 /100 | #312 | Tragic 23.0% |
| Bahamians | 0.0 /100 | #313 | Tragic 23.0% |
| U.S. Virgin Islanders | 0.0 /100 | #314 | Tragic 23.0% |
| Arapaho | 0.0 /100 | #315 | Tragic 23.1% |
| Yakama | 0.0 /100 | #316 | Tragic 23.1% |
| Menominee | 0.0 /100 | #317 | Tragic 23.3% |
| Dutch West Indians | 0.0 /100 | #318 | Tragic 23.3% |
| Chippewa | 0.0 /100 | #319 | Tragic 23.4% |
| Choctaw | 0.0 /100 | #320 | Tragic 23.5% |
| Immigrants | Honduras | 0.0 /100 | #321 | Tragic 23.5% |
| Ute | 0.0 /100 | #322 | Tragic 23.5% |
| Pueblo | 0.0 /100 | #323 | Tragic 23.7% |
| Paiute | 0.0 /100 | #324 | Tragic 23.8% |