Sioux vs Israeli Poverty
COMPARE
Sioux
Israeli
Poverty
Poverty Comparison
Sioux
Israelis
19.8%
POVERTY
0.0/ 100
METRIC RATING
337th/ 347
METRIC RANK
12.5%
POVERTY
36.4/ 100
METRIC RATING
185th/ 347
METRIC RANK
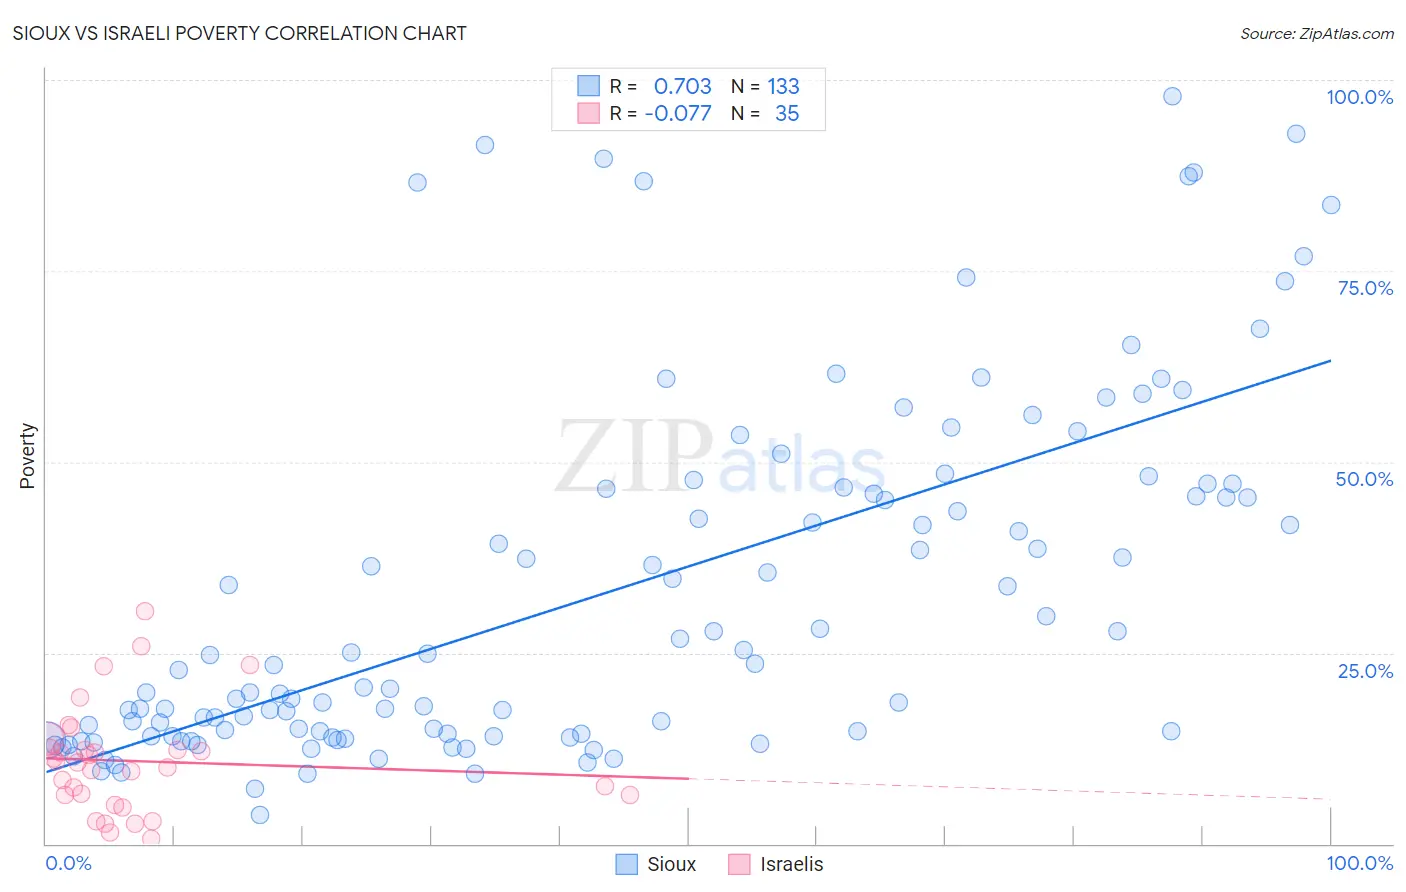
Sioux vs Israeli Poverty Correlation Chart
The statistical analysis conducted on geographies consisting of 234,110,660 people shows a strong positive correlation between the proportion of Sioux and poverty level in the United States with a correlation coefficient (R) of 0.703 and weighted average of 19.8%. Similarly, the statistical analysis conducted on geographies consisting of 211,053,584 people shows a slight negative correlation between the proportion of Israelis and poverty level in the United States with a correlation coefficient (R) of -0.077 and weighted average of 12.5%, a difference of 58.4%.
Poverty Correlation Summary
| Measurement | Sioux | Israeli |
| Minimum | 3.8% | 0.63% |
| Maximum | 97.9% | 30.5% |
| Range | 94.1% | 29.8% |
| Mean | 32.9% | 10.8% |
| Median | 23.5% | 10.7% |
| Interquartile 25% (IQ1) | 14.2% | 6.3% |
| Interquartile 75% (IQ3) | 46.5% | 12.4% |
| Interquartile Range (IQR) | 32.3% | 6.0% |
| Standard Deviation (Sample) | 23.2% | 7.0% |
| Standard Deviation (Population) | 23.1% | 6.9% |
Similar Demographics by Poverty
Demographics Similar to Sioux by Poverty
In terms of poverty, the demographic groups most similar to Sioux are Pueblo (19.4%, a difference of 1.9%), Yuman (20.2%, a difference of 2.2%), Cheyenne (18.9%, a difference of 4.4%), Crow (20.7%, a difference of 4.5%), and Yup'ik (20.8%, a difference of 5.2%).
| Demographics | Rating | Rank | Poverty |
| Dominicans | 0.0 /100 | #330 | Tragic 17.6% |
| Immigrants | Dominican Republic | 0.0 /100 | #331 | Tragic 17.8% |
| Natives/Alaskans | 0.0 /100 | #332 | Tragic 18.1% |
| Houma | 0.0 /100 | #333 | Tragic 18.4% |
| Apache | 0.0 /100 | #334 | Tragic 18.4% |
| Cheyenne | 0.0 /100 | #335 | Tragic 18.9% |
| Pueblo | 0.0 /100 | #336 | Tragic 19.4% |
| Sioux | 0.0 /100 | #337 | Tragic 19.8% |
| Yuman | 0.0 /100 | #338 | Tragic 20.2% |
| Crow | 0.0 /100 | #339 | Tragic 20.7% |
| Yup'ik | 0.0 /100 | #340 | Tragic 20.8% |
| Hopi | 0.0 /100 | #341 | Tragic 20.8% |
| Immigrants | Yemen | 0.0 /100 | #342 | Tragic 21.5% |
| Pima | 0.0 /100 | #343 | Tragic 21.9% |
| Lumbee | 0.0 /100 | #344 | Tragic 21.9% |
Demographics Similar to Israelis by Poverty
In terms of poverty, the demographic groups most similar to Israelis are Immigrants from Sierra Leone (12.5%, a difference of 0.020%), Kenyan (12.5%, a difference of 0.24%), Hawaiian (12.5%, a difference of 0.25%), Immigrants from Costa Rica (12.5%, a difference of 0.34%), and Aleut (12.5%, a difference of 0.34%).
| Demographics | Rating | Rank | Poverty |
| Uruguayans | 44.7 /100 | #178 | Average 12.4% |
| Immigrants | Morocco | 44.0 /100 | #179 | Average 12.4% |
| Mongolians | 43.6 /100 | #180 | Average 12.4% |
| Immigrants | Afghanistan | 42.1 /100 | #181 | Average 12.4% |
| Immigrants | Cameroon | 41.7 /100 | #182 | Average 12.4% |
| Immigrants | Iraq | 40.2 /100 | #183 | Average 12.4% |
| Kenyans | 38.8 /100 | #184 | Fair 12.5% |
| Israelis | 36.4 /100 | #185 | Fair 12.5% |
| Immigrants | Sierra Leone | 36.3 /100 | #186 | Fair 12.5% |
| Hawaiians | 34.1 /100 | #187 | Fair 12.5% |
| Immigrants | Costa Rica | 33.3 /100 | #188 | Fair 12.5% |
| Aleuts | 33.2 /100 | #189 | Fair 12.5% |
| Immigrants | South America | 32.3 /100 | #190 | Fair 12.5% |
| Sierra Leoneans | 31.5 /100 | #191 | Fair 12.6% |
| South American Indians | 23.3 /100 | #192 | Fair 12.7% |