Immigrants from Scotland vs Israeli Poverty
COMPARE
Immigrants from Scotland
Israeli
Poverty
Poverty Comparison
Immigrants from Scotland
Israelis
10.6%
POVERTY
99.7/ 100
METRIC RATING
19th/ 347
METRIC RANK
12.5%
POVERTY
36.4/ 100
METRIC RATING
185th/ 347
METRIC RANK
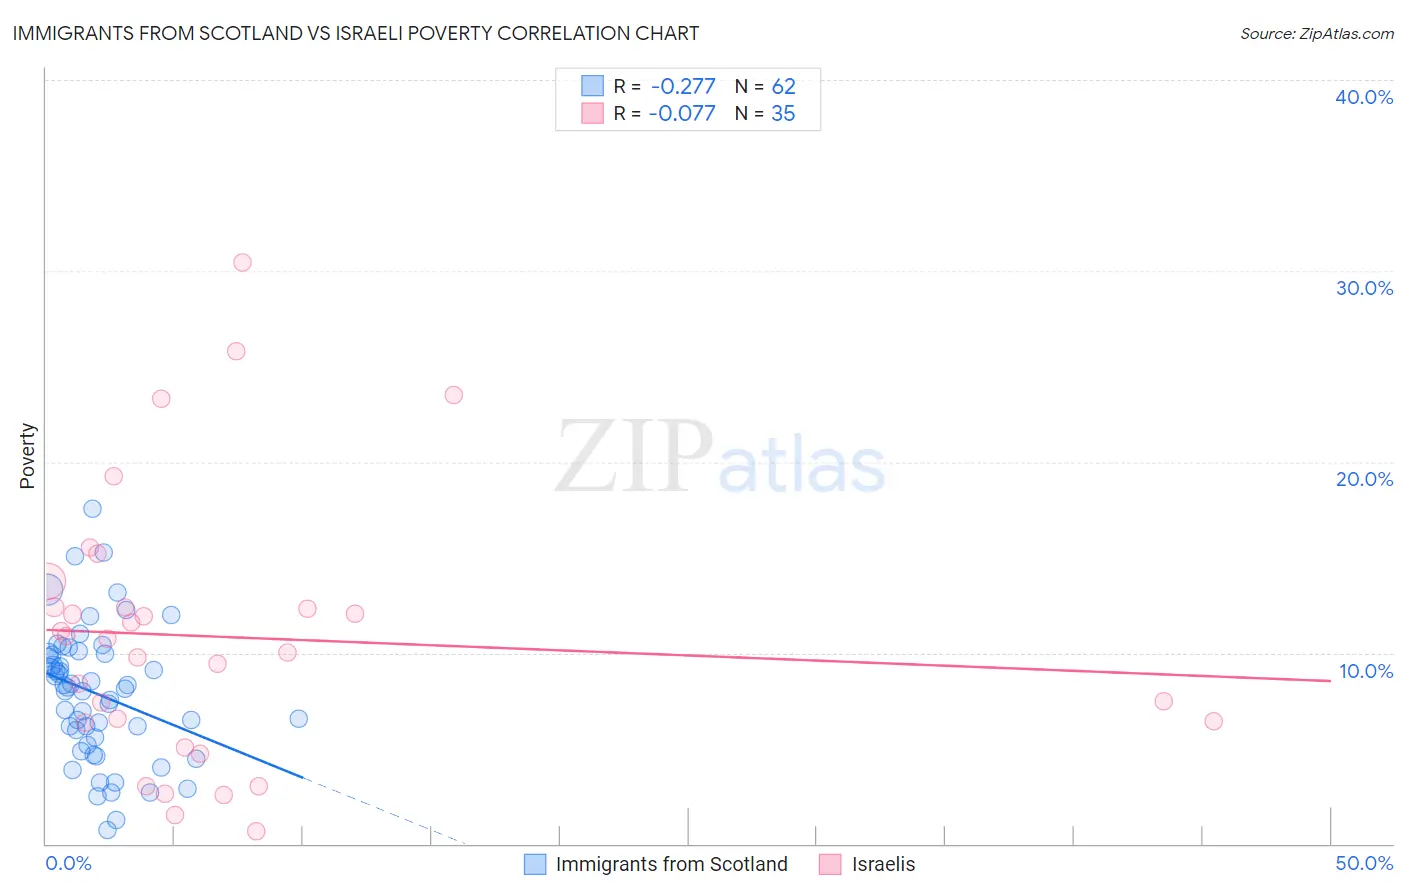
Immigrants from Scotland vs Israeli Poverty Correlation Chart
The statistical analysis conducted on geographies consisting of 196,384,756 people shows a weak negative correlation between the proportion of Immigrants from Scotland and poverty level in the United States with a correlation coefficient (R) of -0.277 and weighted average of 10.6%. Similarly, the statistical analysis conducted on geographies consisting of 211,053,584 people shows a slight negative correlation between the proportion of Israelis and poverty level in the United States with a correlation coefficient (R) of -0.077 and weighted average of 12.5%, a difference of 18.2%.
Poverty Correlation Summary
| Measurement | Immigrants from Scotland | Israeli |
| Minimum | 0.74% | 0.63% |
| Maximum | 17.6% | 30.5% |
| Range | 16.8% | 29.8% |
| Mean | 7.8% | 10.8% |
| Median | 8.2% | 10.7% |
| Interquartile 25% (IQ1) | 5.6% | 6.3% |
| Interquartile 75% (IQ3) | 9.9% | 12.4% |
| Interquartile Range (IQR) | 4.4% | 6.0% |
| Standard Deviation (Sample) | 3.5% | 7.0% |
| Standard Deviation (Population) | 3.4% | 6.9% |
Similar Demographics by Poverty
Demographics Similar to Immigrants from Scotland by Poverty
In terms of poverty, the demographic groups most similar to Immigrants from Scotland are Immigrants from North Macedonia (10.6%, a difference of 0.11%), Luxembourger (10.6%, a difference of 0.19%), Eastern European (10.6%, a difference of 0.35%), Latvian (10.5%, a difference of 0.39%), and Swedish (10.6%, a difference of 0.46%).
| Demographics | Rating | Rank | Poverty |
| Bhutanese | 99.8 /100 | #12 | Exceptional 10.4% |
| Immigrants | Hong Kong | 99.8 /100 | #13 | Exceptional 10.4% |
| Immigrants | Bolivia | 99.8 /100 | #14 | Exceptional 10.4% |
| Bolivians | 99.8 /100 | #15 | Exceptional 10.4% |
| Lithuanians | 99.8 /100 | #16 | Exceptional 10.5% |
| Norwegians | 99.8 /100 | #17 | Exceptional 10.5% |
| Latvians | 99.8 /100 | #18 | Exceptional 10.5% |
| Immigrants | Scotland | 99.7 /100 | #19 | Exceptional 10.6% |
| Immigrants | North Macedonia | 99.7 /100 | #20 | Exceptional 10.6% |
| Luxembourgers | 99.7 /100 | #21 | Exceptional 10.6% |
| Eastern Europeans | 99.7 /100 | #22 | Exceptional 10.6% |
| Swedes | 99.7 /100 | #23 | Exceptional 10.6% |
| Italians | 99.7 /100 | #24 | Exceptional 10.6% |
| Croatians | 99.6 /100 | #25 | Exceptional 10.6% |
| Burmese | 99.6 /100 | #26 | Exceptional 10.7% |
Demographics Similar to Israelis by Poverty
In terms of poverty, the demographic groups most similar to Israelis are Immigrants from Sierra Leone (12.5%, a difference of 0.020%), Kenyan (12.5%, a difference of 0.24%), Hawaiian (12.5%, a difference of 0.25%), Immigrants from Costa Rica (12.5%, a difference of 0.34%), and Aleut (12.5%, a difference of 0.34%).
| Demographics | Rating | Rank | Poverty |
| Uruguayans | 44.7 /100 | #178 | Average 12.4% |
| Immigrants | Morocco | 44.0 /100 | #179 | Average 12.4% |
| Mongolians | 43.6 /100 | #180 | Average 12.4% |
| Immigrants | Afghanistan | 42.1 /100 | #181 | Average 12.4% |
| Immigrants | Cameroon | 41.7 /100 | #182 | Average 12.4% |
| Immigrants | Iraq | 40.2 /100 | #183 | Average 12.4% |
| Kenyans | 38.8 /100 | #184 | Fair 12.5% |
| Israelis | 36.4 /100 | #185 | Fair 12.5% |
| Immigrants | Sierra Leone | 36.3 /100 | #186 | Fair 12.5% |
| Hawaiians | 34.1 /100 | #187 | Fair 12.5% |
| Immigrants | Costa Rica | 33.3 /100 | #188 | Fair 12.5% |
| Aleuts | 33.2 /100 | #189 | Fair 12.5% |
| Immigrants | South America | 32.3 /100 | #190 | Fair 12.5% |
| Sierra Leoneans | 31.5 /100 | #191 | Fair 12.6% |
| South American Indians | 23.3 /100 | #192 | Fair 12.7% |