Immigrants from Trinidad and Tobago vs Israeli Poverty
COMPARE
Immigrants from Trinidad and Tobago
Israeli
Poverty
Poverty Comparison
Immigrants from Trinidad and Tobago
Israelis
14.2%
POVERTY
0.2/ 100
METRIC RATING
253rd/ 347
METRIC RANK
12.5%
POVERTY
36.4/ 100
METRIC RATING
185th/ 347
METRIC RANK
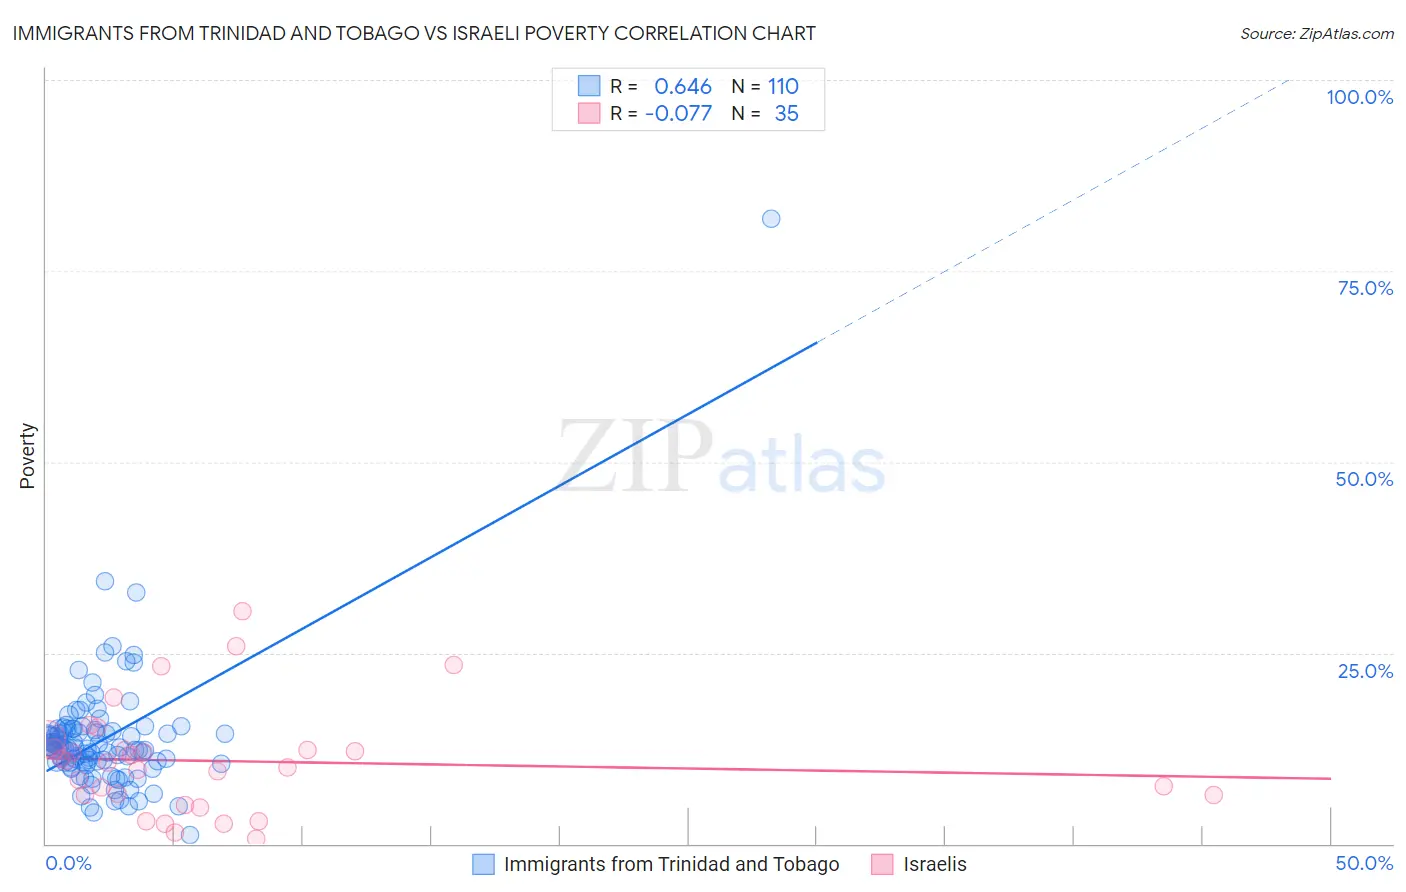
Immigrants from Trinidad and Tobago vs Israeli Poverty Correlation Chart
The statistical analysis conducted on geographies consisting of 223,476,613 people shows a significant positive correlation between the proportion of Immigrants from Trinidad and Tobago and poverty level in the United States with a correlation coefficient (R) of 0.646 and weighted average of 14.2%. Similarly, the statistical analysis conducted on geographies consisting of 211,053,584 people shows a slight negative correlation between the proportion of Israelis and poverty level in the United States with a correlation coefficient (R) of -0.077 and weighted average of 12.5%, a difference of 14.1%.
Poverty Correlation Summary
| Measurement | Immigrants from Trinidad and Tobago | Israeli |
| Minimum | 1.1% | 0.63% |
| Maximum | 81.9% | 30.5% |
| Range | 80.8% | 29.8% |
| Mean | 13.7% | 10.8% |
| Median | 12.5% | 10.7% |
| Interquartile 25% (IQ1) | 10.6% | 6.3% |
| Interquartile 75% (IQ3) | 14.9% | 12.4% |
| Interquartile Range (IQR) | 4.3% | 6.0% |
| Standard Deviation (Sample) | 8.4% | 7.0% |
| Standard Deviation (Population) | 8.4% | 6.9% |
Similar Demographics by Poverty
Demographics Similar to Immigrants from Trinidad and Tobago by Poverty
In terms of poverty, the demographic groups most similar to Immigrants from Trinidad and Tobago are Spanish American Indian (14.2%, a difference of 0.10%), Immigrants from Burma/Myanmar (14.2%, a difference of 0.22%), Immigrants from El Salvador (14.3%, a difference of 0.25%), Cree (14.2%, a difference of 0.31%), and Immigrants from Ecuador (14.3%, a difference of 0.35%).
| Demographics | Rating | Rank | Poverty |
| Potawatomi | 0.3 /100 | #246 | Tragic 14.1% |
| Liberians | 0.2 /100 | #247 | Tragic 14.1% |
| Immigrants | Western Africa | 0.2 /100 | #248 | Tragic 14.1% |
| Immigrants | Ghana | 0.2 /100 | #249 | Tragic 14.2% |
| Cree | 0.2 /100 | #250 | Tragic 14.2% |
| Immigrants | Burma/Myanmar | 0.2 /100 | #251 | Tragic 14.2% |
| Spanish American Indians | 0.2 /100 | #252 | Tragic 14.2% |
| Immigrants | Trinidad and Tobago | 0.2 /100 | #253 | Tragic 14.2% |
| Immigrants | El Salvador | 0.1 /100 | #254 | Tragic 14.3% |
| Immigrants | Ecuador | 0.1 /100 | #255 | Tragic 14.3% |
| Mexican American Indians | 0.1 /100 | #256 | Tragic 14.3% |
| Trinidadians and Tobagonians | 0.1 /100 | #257 | Tragic 14.3% |
| Ottawa | 0.1 /100 | #258 | Tragic 14.3% |
| Immigrants | Nicaragua | 0.1 /100 | #259 | Tragic 14.3% |
| Cape Verdeans | 0.1 /100 | #260 | Tragic 14.4% |
Demographics Similar to Israelis by Poverty
In terms of poverty, the demographic groups most similar to Israelis are Immigrants from Sierra Leone (12.5%, a difference of 0.020%), Kenyan (12.5%, a difference of 0.24%), Hawaiian (12.5%, a difference of 0.25%), Immigrants from Costa Rica (12.5%, a difference of 0.34%), and Aleut (12.5%, a difference of 0.34%).
| Demographics | Rating | Rank | Poverty |
| Uruguayans | 44.7 /100 | #178 | Average 12.4% |
| Immigrants | Morocco | 44.0 /100 | #179 | Average 12.4% |
| Mongolians | 43.6 /100 | #180 | Average 12.4% |
| Immigrants | Afghanistan | 42.1 /100 | #181 | Average 12.4% |
| Immigrants | Cameroon | 41.7 /100 | #182 | Average 12.4% |
| Immigrants | Iraq | 40.2 /100 | #183 | Average 12.4% |
| Kenyans | 38.8 /100 | #184 | Fair 12.5% |
| Israelis | 36.4 /100 | #185 | Fair 12.5% |
| Immigrants | Sierra Leone | 36.3 /100 | #186 | Fair 12.5% |
| Hawaiians | 34.1 /100 | #187 | Fair 12.5% |
| Immigrants | Costa Rica | 33.3 /100 | #188 | Fair 12.5% |
| Aleuts | 33.2 /100 | #189 | Fair 12.5% |
| Immigrants | South America | 32.3 /100 | #190 | Fair 12.5% |
| Sierra Leoneans | 31.5 /100 | #191 | Fair 12.6% |
| South American Indians | 23.3 /100 | #192 | Fair 12.7% |