Spanish American vs Israeli Poverty
COMPARE
Spanish American
Israeli
Poverty
Poverty Comparison
Spanish Americans
Israelis
14.7%
POVERTY
0.0/ 100
METRIC RATING
273rd/ 347
METRIC RANK
12.5%
POVERTY
36.4/ 100
METRIC RATING
185th/ 347
METRIC RANK
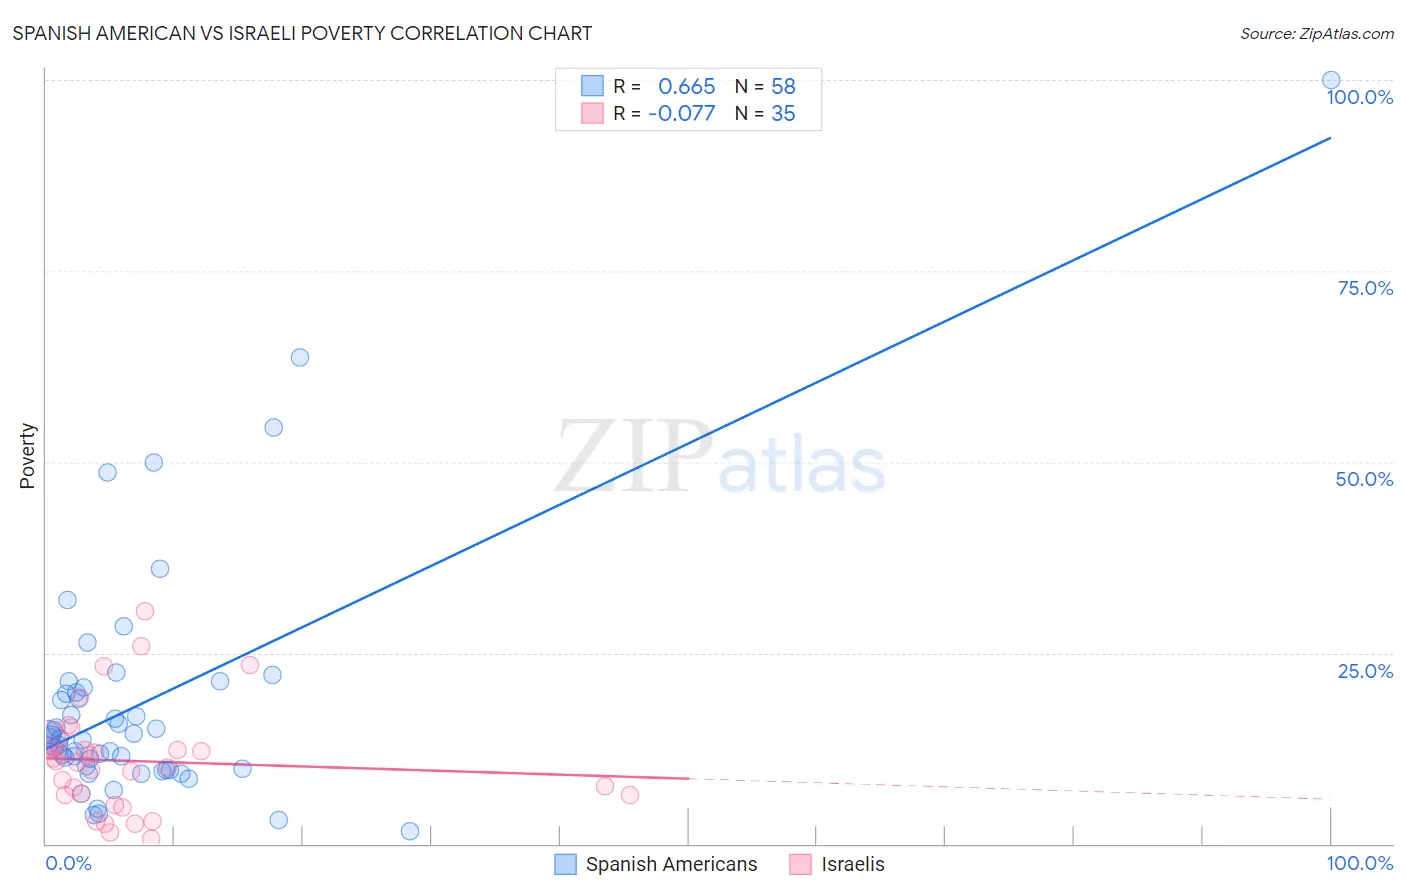
Spanish American vs Israeli Poverty Correlation Chart
The statistical analysis conducted on geographies consisting of 103,164,738 people shows a significant positive correlation between the proportion of Spanish Americans and poverty level in the United States with a correlation coefficient (R) of 0.665 and weighted average of 14.7%. Similarly, the statistical analysis conducted on geographies consisting of 211,053,584 people shows a slight negative correlation between the proportion of Israelis and poverty level in the United States with a correlation coefficient (R) of -0.077 and weighted average of 12.5%, a difference of 18.1%.
Poverty Correlation Summary
| Measurement | Spanish American | Israeli |
| Minimum | 1.6% | 0.63% |
| Maximum | 100.0% | 30.5% |
| Range | 98.4% | 29.8% |
| Mean | 18.4% | 10.8% |
| Median | 13.8% | 10.7% |
| Interquartile 25% (IQ1) | 9.8% | 6.3% |
| Interquartile 75% (IQ3) | 19.8% | 12.4% |
| Interquartile Range (IQR) | 10.0% | 6.0% |
| Standard Deviation (Sample) | 16.4% | 7.0% |
| Standard Deviation (Population) | 16.3% | 6.9% |
Similar Demographics by Poverty
Demographics Similar to Spanish Americans by Poverty
In terms of poverty, the demographic groups most similar to Spanish Americans are Barbadian (14.8%, a difference of 0.39%), Immigrants from West Indies (14.8%, a difference of 0.43%), Immigrants from Bahamas (14.8%, a difference of 0.43%), Bangladeshi (14.8%, a difference of 0.48%), and Belizean (14.8%, a difference of 0.50%).
| Demographics | Rating | Rank | Poverty |
| Guyanese | 0.1 /100 | #266 | Tragic 14.5% |
| Iroquois | 0.1 /100 | #267 | Tragic 14.5% |
| Sub-Saharan Africans | 0.1 /100 | #268 | Tragic 14.5% |
| Immigrants | Cuba | 0.1 /100 | #269 | Tragic 14.6% |
| Central Americans | 0.1 /100 | #270 | Tragic 14.6% |
| Shoshone | 0.0 /100 | #271 | Tragic 14.7% |
| Chickasaw | 0.0 /100 | #272 | Tragic 14.7% |
| Spanish Americans | 0.0 /100 | #273 | Tragic 14.7% |
| Barbadians | 0.0 /100 | #274 | Tragic 14.8% |
| Immigrants | West Indies | 0.0 /100 | #275 | Tragic 14.8% |
| Immigrants | Bahamas | 0.0 /100 | #276 | Tragic 14.8% |
| Bangladeshis | 0.0 /100 | #277 | Tragic 14.8% |
| Belizeans | 0.0 /100 | #278 | Tragic 14.8% |
| Immigrants | St. Vincent and the Grenadines | 0.0 /100 | #279 | Tragic 14.9% |
| Haitians | 0.0 /100 | #280 | Tragic 14.9% |
Demographics Similar to Israelis by Poverty
In terms of poverty, the demographic groups most similar to Israelis are Immigrants from Sierra Leone (12.5%, a difference of 0.020%), Kenyan (12.5%, a difference of 0.24%), Hawaiian (12.5%, a difference of 0.25%), Immigrants from Costa Rica (12.5%, a difference of 0.34%), and Aleut (12.5%, a difference of 0.34%).
| Demographics | Rating | Rank | Poverty |
| Uruguayans | 44.7 /100 | #178 | Average 12.4% |
| Immigrants | Morocco | 44.0 /100 | #179 | Average 12.4% |
| Mongolians | 43.6 /100 | #180 | Average 12.4% |
| Immigrants | Afghanistan | 42.1 /100 | #181 | Average 12.4% |
| Immigrants | Cameroon | 41.7 /100 | #182 | Average 12.4% |
| Immigrants | Iraq | 40.2 /100 | #183 | Average 12.4% |
| Kenyans | 38.8 /100 | #184 | Fair 12.5% |
| Israelis | 36.4 /100 | #185 | Fair 12.5% |
| Immigrants | Sierra Leone | 36.3 /100 | #186 | Fair 12.5% |
| Hawaiians | 34.1 /100 | #187 | Fair 12.5% |
| Immigrants | Costa Rica | 33.3 /100 | #188 | Fair 12.5% |
| Aleuts | 33.2 /100 | #189 | Fair 12.5% |
| Immigrants | South America | 32.3 /100 | #190 | Fair 12.5% |
| Sierra Leoneans | 31.5 /100 | #191 | Fair 12.6% |
| South American Indians | 23.3 /100 | #192 | Fair 12.7% |