Cree vs Basque Poverty
COMPARE
Cree
Basque
Poverty
Poverty Comparison
Cree
Basques
14.2%
POVERTY
0.2/ 100
METRIC RATING
250th/ 347
METRIC RANK
11.9%
POVERTY
80.4/ 100
METRIC RATING
142nd/ 347
METRIC RANK
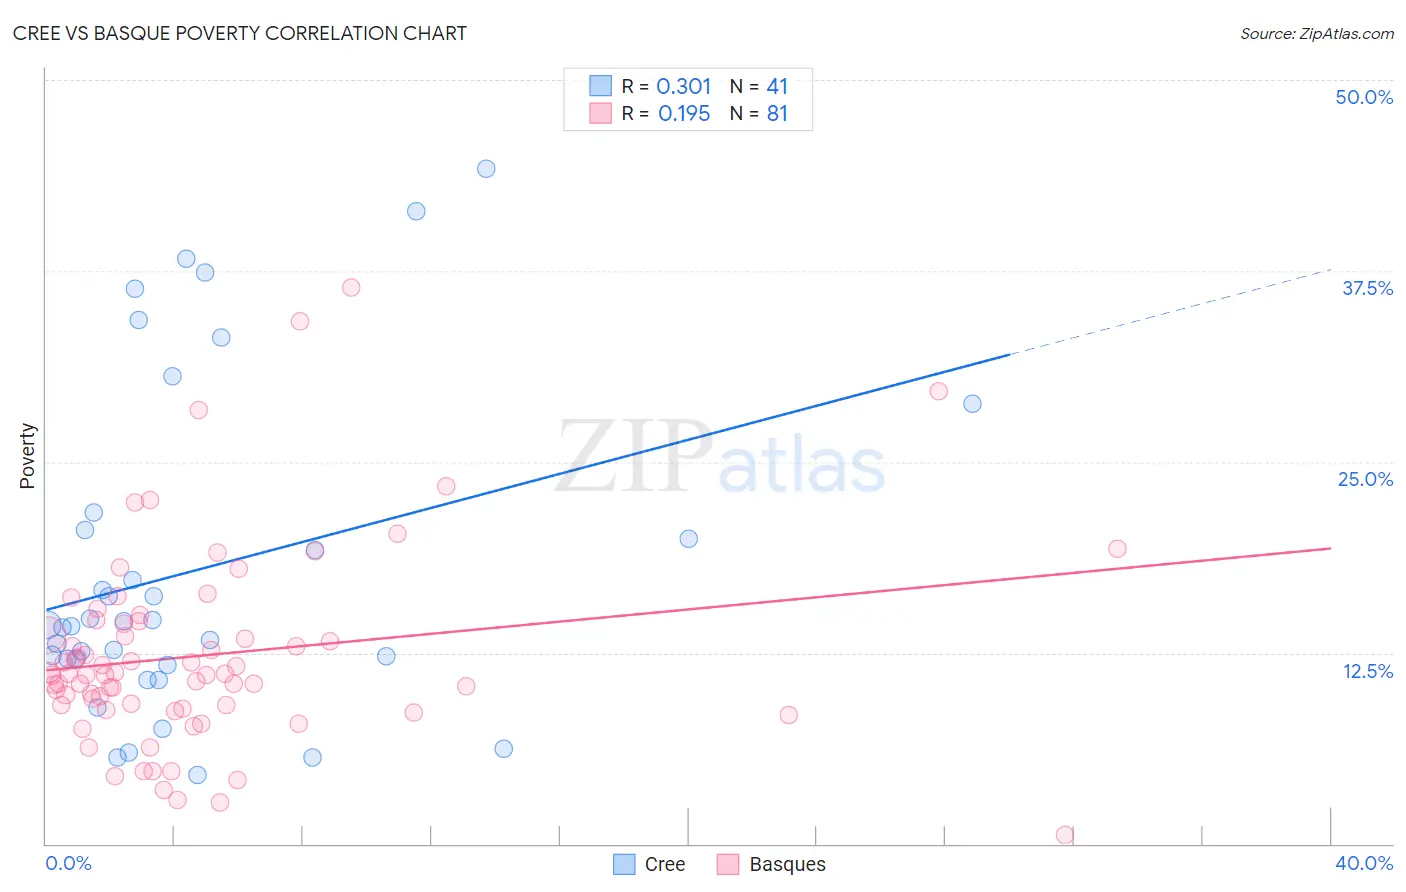
Cree vs Basque Poverty Correlation Chart
The statistical analysis conducted on geographies consisting of 76,209,034 people shows a mild positive correlation between the proportion of Cree and poverty level in the United States with a correlation coefficient (R) of 0.301 and weighted average of 14.2%. Similarly, the statistical analysis conducted on geographies consisting of 165,732,403 people shows a poor positive correlation between the proportion of Basques and poverty level in the United States with a correlation coefficient (R) of 0.195 and weighted average of 11.9%, a difference of 19.4%.
Poverty Correlation Summary
| Measurement | Cree | Basque |
| Minimum | 4.5% | 0.59% |
| Maximum | 44.2% | 36.5% |
| Range | 39.7% | 35.9% |
| Mean | 18.0% | 12.3% |
| Median | 14.3% | 11.1% |
| Interquartile 25% (IQ1) | 11.9% | 9.0% |
| Interquartile 75% (IQ3) | 21.1% | 14.5% |
| Interquartile Range (IQR) | 9.2% | 5.5% |
| Standard Deviation (Sample) | 10.7% | 6.4% |
| Standard Deviation (Population) | 10.6% | 6.4% |
Similar Demographics by Poverty
Demographics Similar to Cree by Poverty
In terms of poverty, the demographic groups most similar to Cree are Immigrants from Burma/Myanmar (14.2%, a difference of 0.090%), Spanish American Indian (14.2%, a difference of 0.20%), Immigrants from Ghana (14.2%, a difference of 0.30%), Immigrants from Trinidad and Tobago (14.2%, a difference of 0.31%), and Immigrants from Western Africa (14.1%, a difference of 0.39%).
| Demographics | Rating | Rank | Poverty |
| Sudanese | 0.3 /100 | #243 | Tragic 14.0% |
| Nepalese | 0.3 /100 | #244 | Tragic 14.0% |
| Immigrants | Sudan | 0.3 /100 | #245 | Tragic 14.1% |
| Potawatomi | 0.3 /100 | #246 | Tragic 14.1% |
| Liberians | 0.2 /100 | #247 | Tragic 14.1% |
| Immigrants | Western Africa | 0.2 /100 | #248 | Tragic 14.1% |
| Immigrants | Ghana | 0.2 /100 | #249 | Tragic 14.2% |
| Cree | 0.2 /100 | #250 | Tragic 14.2% |
| Immigrants | Burma/Myanmar | 0.2 /100 | #251 | Tragic 14.2% |
| Spanish American Indians | 0.2 /100 | #252 | Tragic 14.2% |
| Immigrants | Trinidad and Tobago | 0.2 /100 | #253 | Tragic 14.2% |
| Immigrants | El Salvador | 0.1 /100 | #254 | Tragic 14.3% |
| Immigrants | Ecuador | 0.1 /100 | #255 | Tragic 14.3% |
| Mexican American Indians | 0.1 /100 | #256 | Tragic 14.3% |
| Trinidadians and Tobagonians | 0.1 /100 | #257 | Tragic 14.3% |
Demographics Similar to Basques by Poverty
In terms of poverty, the demographic groups most similar to Basques are Immigrants from France (11.9%, a difference of 0.020%), Immigrants from Peru (11.9%, a difference of 0.11%), Brazilian (11.9%, a difference of 0.11%), Pakistani (11.9%, a difference of 0.30%), and Immigrants from Jordan (11.9%, a difference of 0.32%).
| Demographics | Rating | Rank | Poverty |
| Immigrants | Vietnam | 85.2 /100 | #135 | Excellent 11.8% |
| Chileans | 84.2 /100 | #136 | Excellent 11.8% |
| Immigrants | Switzerland | 83.0 /100 | #137 | Excellent 11.8% |
| Immigrants | Jordan | 82.4 /100 | #138 | Excellent 11.9% |
| Pakistanis | 82.2 /100 | #139 | Excellent 11.9% |
| Immigrants | Peru | 81.1 /100 | #140 | Excellent 11.9% |
| Immigrants | France | 80.5 /100 | #141 | Excellent 11.9% |
| Basques | 80.4 /100 | #142 | Excellent 11.9% |
| Brazilians | 79.7 /100 | #143 | Good 11.9% |
| Icelanders | 77.9 /100 | #144 | Good 11.9% |
| Syrians | 75.1 /100 | #145 | Good 12.0% |
| Afghans | 74.9 /100 | #146 | Good 12.0% |
| Immigrants | Bosnia and Herzegovina | 73.7 /100 | #147 | Good 12.0% |
| Immigrants | Germany | 72.7 /100 | #148 | Good 12.0% |
| Immigrants | Malaysia | 72.7 /100 | #149 | Good 12.0% |