Immigrants from North America vs Basque Poverty
COMPARE
Immigrants from North America
Basque
Poverty
Poverty Comparison
Immigrants from North America
Basques
11.3%
POVERTY
96.8/ 100
METRIC RATING
76th/ 347
METRIC RANK
11.9%
POVERTY
80.4/ 100
METRIC RATING
142nd/ 347
METRIC RANK
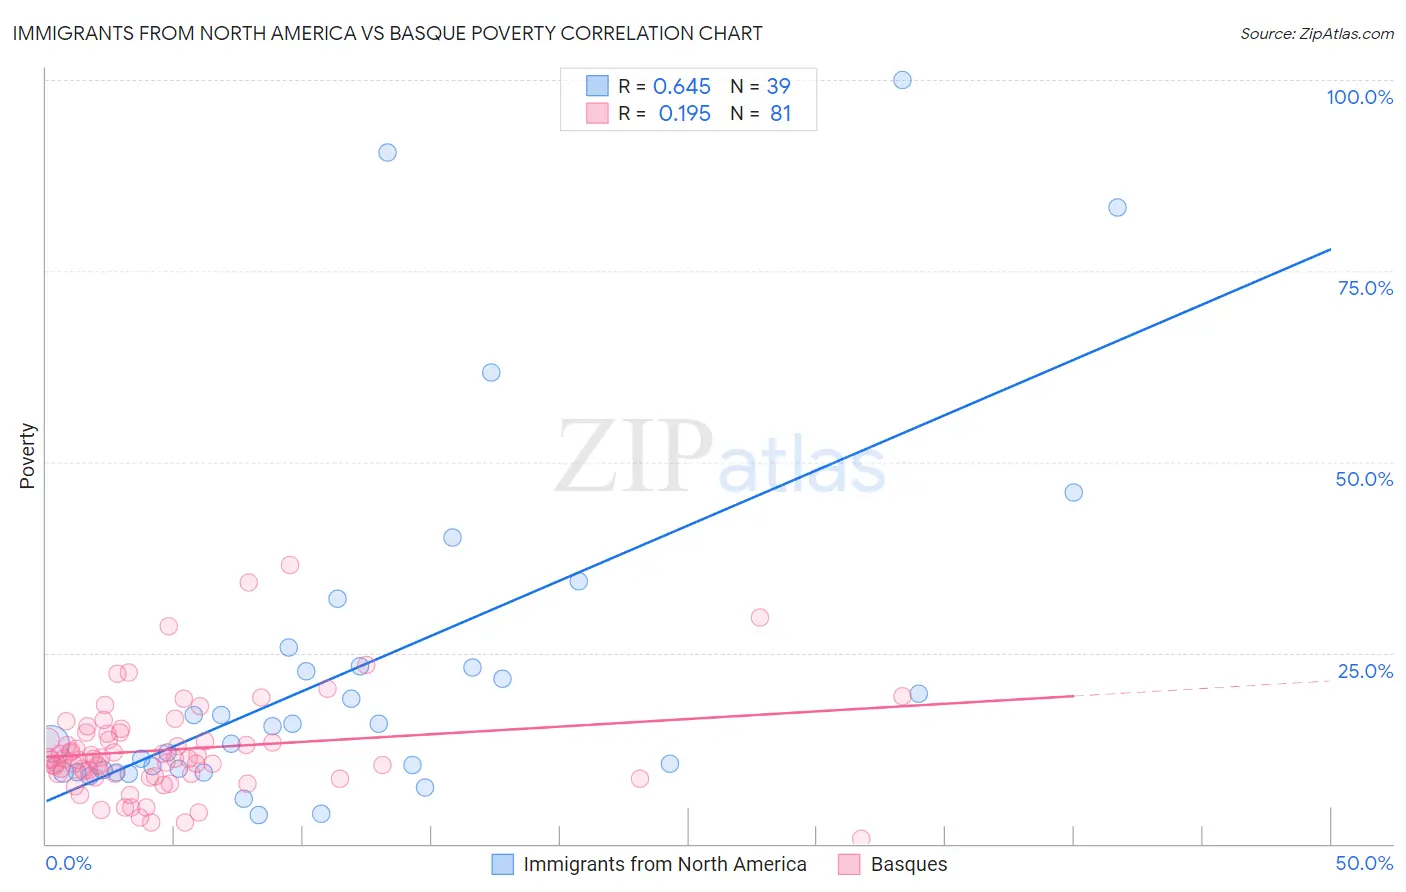
Immigrants from North America vs Basque Poverty Correlation Chart
The statistical analysis conducted on geographies consisting of 462,172,327 people shows a significant positive correlation between the proportion of Immigrants from North America and poverty level in the United States with a correlation coefficient (R) of 0.645 and weighted average of 11.3%. Similarly, the statistical analysis conducted on geographies consisting of 165,732,403 people shows a poor positive correlation between the proportion of Basques and poverty level in the United States with a correlation coefficient (R) of 0.195 and weighted average of 11.9%, a difference of 5.3%.
Poverty Correlation Summary
| Measurement | Immigrants from North America | Basque |
| Minimum | 3.8% | 0.59% |
| Maximum | 100.0% | 36.5% |
| Range | 96.2% | 35.9% |
| Mean | 23.1% | 12.3% |
| Median | 15.4% | 11.1% |
| Interquartile 25% (IQ1) | 9.4% | 9.0% |
| Interquartile 75% (IQ3) | 23.2% | 14.5% |
| Interquartile Range (IQR) | 13.8% | 5.5% |
| Standard Deviation (Sample) | 23.3% | 6.4% |
| Standard Deviation (Population) | 23.0% | 6.4% |
Similar Demographics by Poverty
Demographics Similar to Immigrants from North America by Poverty
In terms of poverty, the demographic groups most similar to Immigrants from North America are Immigrants from Eastern Asia (11.3%, a difference of 0.070%), Dutch (11.3%, a difference of 0.080%), Cambodian (11.3%, a difference of 0.13%), Indian (Asian) (11.3%, a difference of 0.14%), and Immigrants from Eastern Europe (11.3%, a difference of 0.15%).
| Demographics | Rating | Rank | Poverty |
| Serbians | 97.4 /100 | #69 | Exceptional 11.2% |
| Immigrants | Canada | 97.3 /100 | #70 | Exceptional 11.3% |
| Zimbabweans | 97.3 /100 | #71 | Exceptional 11.3% |
| Europeans | 97.2 /100 | #72 | Exceptional 11.3% |
| Immigrants | Belgium | 97.2 /100 | #73 | Exceptional 11.3% |
| Carpatho Rusyns | 97.2 /100 | #74 | Exceptional 11.3% |
| Immigrants | Eastern Europe | 97.0 /100 | #75 | Exceptional 11.3% |
| Immigrants | North America | 96.8 /100 | #76 | Exceptional 11.3% |
| Immigrants | Eastern Asia | 96.7 /100 | #77 | Exceptional 11.3% |
| Dutch | 96.7 /100 | #78 | Exceptional 11.3% |
| Cambodians | 96.7 /100 | #79 | Exceptional 11.3% |
| Indians (Asian) | 96.6 /100 | #80 | Exceptional 11.3% |
| Irish | 96.6 /100 | #81 | Exceptional 11.3% |
| Egyptians | 96.5 /100 | #82 | Exceptional 11.3% |
| Immigrants | Sweden | 96.3 /100 | #83 | Exceptional 11.3% |
Demographics Similar to Basques by Poverty
In terms of poverty, the demographic groups most similar to Basques are Immigrants from France (11.9%, a difference of 0.020%), Immigrants from Peru (11.9%, a difference of 0.11%), Brazilian (11.9%, a difference of 0.11%), Pakistani (11.9%, a difference of 0.30%), and Immigrants from Jordan (11.9%, a difference of 0.32%).
| Demographics | Rating | Rank | Poverty |
| Immigrants | Vietnam | 85.2 /100 | #135 | Excellent 11.8% |
| Chileans | 84.2 /100 | #136 | Excellent 11.8% |
| Immigrants | Switzerland | 83.0 /100 | #137 | Excellent 11.8% |
| Immigrants | Jordan | 82.4 /100 | #138 | Excellent 11.9% |
| Pakistanis | 82.2 /100 | #139 | Excellent 11.9% |
| Immigrants | Peru | 81.1 /100 | #140 | Excellent 11.9% |
| Immigrants | France | 80.5 /100 | #141 | Excellent 11.9% |
| Basques | 80.4 /100 | #142 | Excellent 11.9% |
| Brazilians | 79.7 /100 | #143 | Good 11.9% |
| Icelanders | 77.9 /100 | #144 | Good 11.9% |
| Syrians | 75.1 /100 | #145 | Good 12.0% |
| Afghans | 74.9 /100 | #146 | Good 12.0% |
| Immigrants | Bosnia and Herzegovina | 73.7 /100 | #147 | Good 12.0% |
| Immigrants | Germany | 72.7 /100 | #148 | Good 12.0% |
| Immigrants | Malaysia | 72.7 /100 | #149 | Good 12.0% |