Immigrants from Uruguay vs Basque Poverty
COMPARE
Immigrants from Uruguay
Basque
Poverty
Poverty Comparison
Immigrants from Uruguay
Basques
12.8%
POVERTY
15.6/ 100
METRIC RATING
202nd/ 347
METRIC RANK
11.9%
POVERTY
80.4/ 100
METRIC RATING
142nd/ 347
METRIC RANK
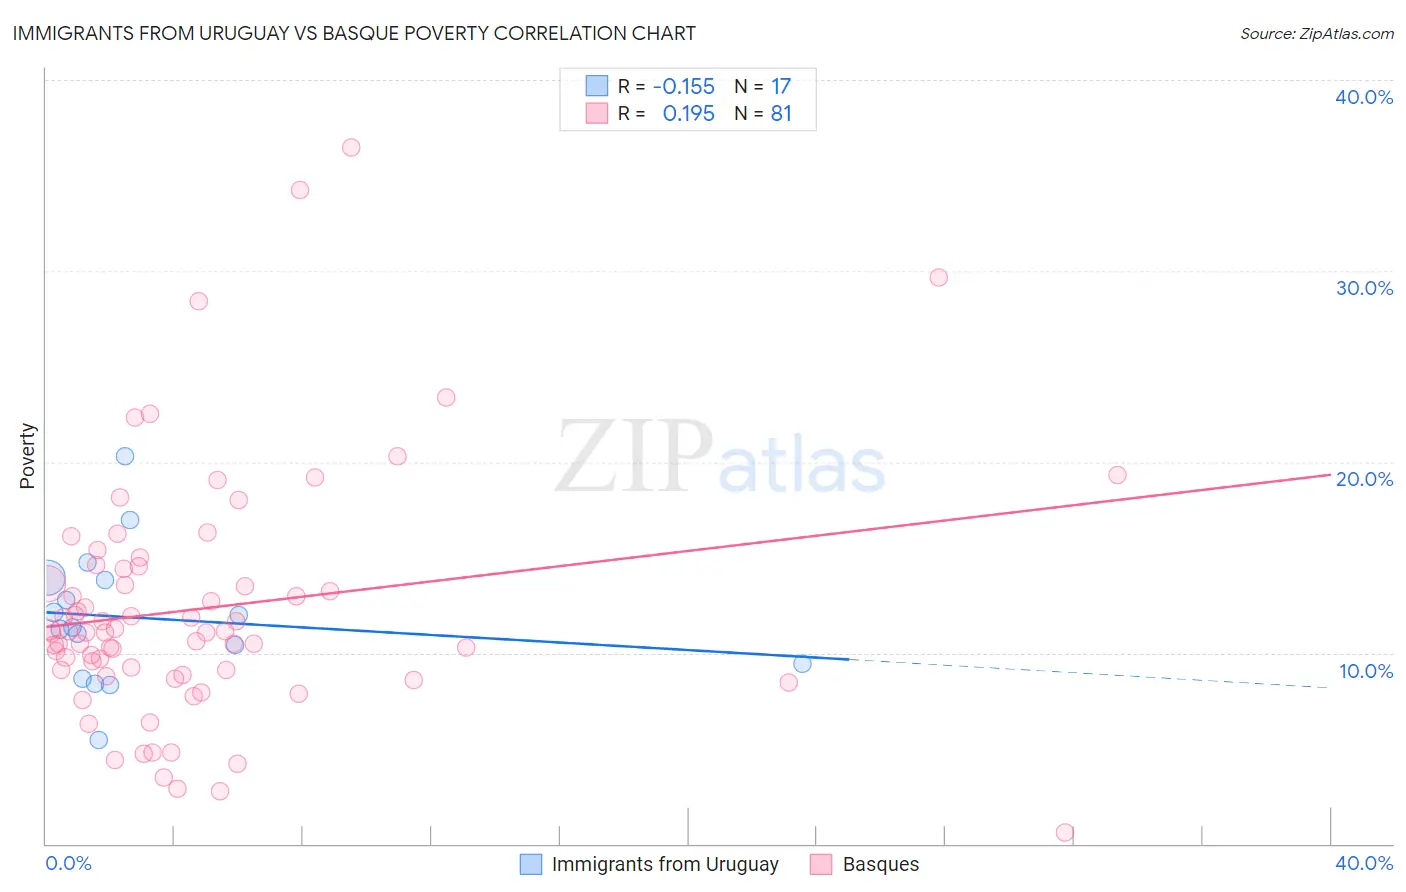
Immigrants from Uruguay vs Basque Poverty Correlation Chart
The statistical analysis conducted on geographies consisting of 133,245,054 people shows a poor negative correlation between the proportion of Immigrants from Uruguay and poverty level in the United States with a correlation coefficient (R) of -0.155 and weighted average of 12.8%. Similarly, the statistical analysis conducted on geographies consisting of 165,732,403 people shows a poor positive correlation between the proportion of Basques and poverty level in the United States with a correlation coefficient (R) of 0.195 and weighted average of 11.9%, a difference of 7.8%.
Poverty Correlation Summary
| Measurement | Immigrants from Uruguay | Basque |
| Minimum | 5.4% | 0.59% |
| Maximum | 20.3% | 36.5% |
| Range | 14.9% | 35.9% |
| Mean | 11.8% | 12.3% |
| Median | 11.4% | 11.1% |
| Interquartile 25% (IQ1) | 9.0% | 9.0% |
| Interquartile 75% (IQ3) | 13.9% | 14.5% |
| Interquartile Range (IQR) | 4.8% | 5.5% |
| Standard Deviation (Sample) | 3.5% | 6.4% |
| Standard Deviation (Population) | 3.4% | 6.4% |
Similar Demographics by Poverty
Demographics Similar to Immigrants from Uruguay by Poverty
In terms of poverty, the demographic groups most similar to Immigrants from Uruguay are Hmong (12.8%, a difference of 0.10%), Spaniard (12.8%, a difference of 0.16%), Immigrants from Uganda (12.8%, a difference of 0.16%), Immigrants from Western Asia (12.9%, a difference of 0.26%), and Immigrants from Kenya (12.8%, a difference of 0.32%).
| Demographics | Rating | Rank | Poverty |
| Immigrants | Kuwait | 20.9 /100 | #195 | Fair 12.7% |
| Iraqis | 20.8 /100 | #196 | Fair 12.7% |
| Immigrants | Lebanon | 18.7 /100 | #197 | Poor 12.8% |
| Spanish | 18.7 /100 | #198 | Poor 12.8% |
| Immigrants | Kenya | 17.5 /100 | #199 | Poor 12.8% |
| Spaniards | 16.5 /100 | #200 | Poor 12.8% |
| Immigrants | Uganda | 16.5 /100 | #201 | Poor 12.8% |
| Immigrants | Uruguay | 15.6 /100 | #202 | Poor 12.8% |
| Hmong | 15.0 /100 | #203 | Poor 12.8% |
| Immigrants | Western Asia | 14.1 /100 | #204 | Poor 12.9% |
| Tsimshian | 9.2 /100 | #205 | Tragic 13.0% |
| Immigrants | Eastern Africa | 7.0 /100 | #206 | Tragic 13.1% |
| Panamanians | 6.6 /100 | #207 | Tragic 13.1% |
| Ugandans | 6.2 /100 | #208 | Tragic 13.1% |
| Malaysians | 6.1 /100 | #209 | Tragic 13.1% |
Demographics Similar to Basques by Poverty
In terms of poverty, the demographic groups most similar to Basques are Immigrants from France (11.9%, a difference of 0.020%), Immigrants from Peru (11.9%, a difference of 0.11%), Brazilian (11.9%, a difference of 0.11%), Pakistani (11.9%, a difference of 0.30%), and Immigrants from Jordan (11.9%, a difference of 0.32%).
| Demographics | Rating | Rank | Poverty |
| Immigrants | Vietnam | 85.2 /100 | #135 | Excellent 11.8% |
| Chileans | 84.2 /100 | #136 | Excellent 11.8% |
| Immigrants | Switzerland | 83.0 /100 | #137 | Excellent 11.8% |
| Immigrants | Jordan | 82.4 /100 | #138 | Excellent 11.9% |
| Pakistanis | 82.2 /100 | #139 | Excellent 11.9% |
| Immigrants | Peru | 81.1 /100 | #140 | Excellent 11.9% |
| Immigrants | France | 80.5 /100 | #141 | Excellent 11.9% |
| Basques | 80.4 /100 | #142 | Excellent 11.9% |
| Brazilians | 79.7 /100 | #143 | Good 11.9% |
| Icelanders | 77.9 /100 | #144 | Good 11.9% |
| Syrians | 75.1 /100 | #145 | Good 12.0% |
| Afghans | 74.9 /100 | #146 | Good 12.0% |
| Immigrants | Bosnia and Herzegovina | 73.7 /100 | #147 | Good 12.0% |
| Immigrants | Germany | 72.7 /100 | #148 | Good 12.0% |
| Immigrants | Malaysia | 72.7 /100 | #149 | Good 12.0% |