Trinidadian and Tobagonian vs Barbadian Poverty
COMPARE
Trinidadian and Tobagonian
Barbadian
Poverty
Poverty Comparison
Trinidadians and Tobagonians
Barbadians
14.3%
POVERTY
0.1/ 100
METRIC RATING
257th/ 347
METRIC RANK
14.8%
POVERTY
0.0/ 100
METRIC RATING
274th/ 347
METRIC RANK
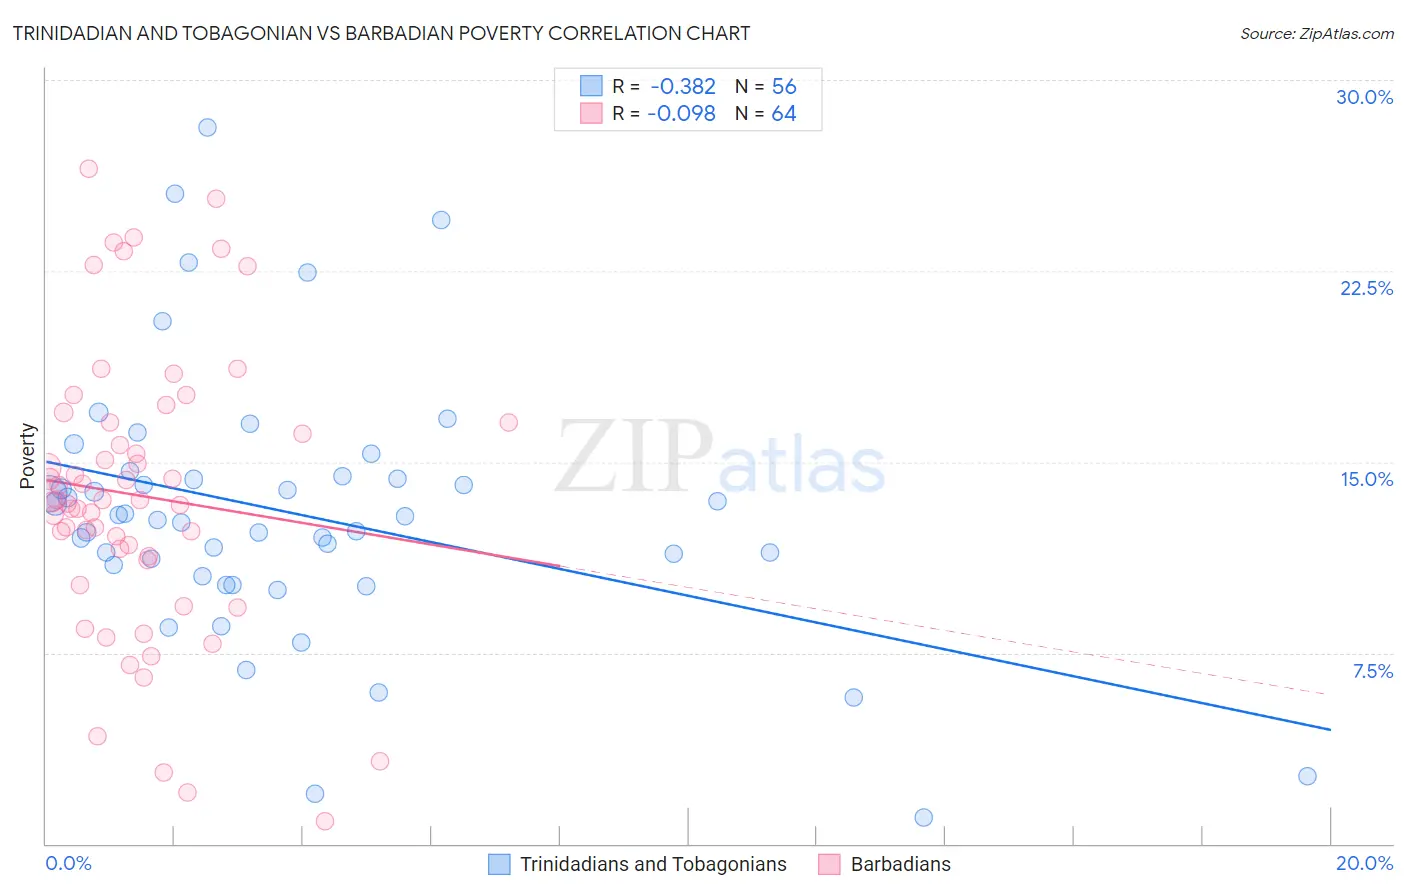
Trinidadian and Tobagonian vs Barbadian Poverty Correlation Chart
The statistical analysis conducted on geographies consisting of 219,718,536 people shows a mild negative correlation between the proportion of Trinidadians and Tobagonians and poverty level in the United States with a correlation coefficient (R) of -0.382 and weighted average of 14.3%. Similarly, the statistical analysis conducted on geographies consisting of 141,278,644 people shows a slight negative correlation between the proportion of Barbadians and poverty level in the United States with a correlation coefficient (R) of -0.098 and weighted average of 14.8%, a difference of 3.5%.
Poverty Correlation Summary
| Measurement | Trinidadian and Tobagonian | Barbadian |
| Minimum | 1.0% | 0.88% |
| Maximum | 28.1% | 26.5% |
| Range | 27.1% | 25.6% |
| Mean | 13.0% | 13.7% |
| Median | 12.8% | 13.5% |
| Interquartile 25% (IQ1) | 10.7% | 11.2% |
| Interquartile 75% (IQ3) | 14.4% | 16.5% |
| Interquartile Range (IQR) | 3.7% | 5.3% |
| Standard Deviation (Sample) | 5.2% | 5.6% |
| Standard Deviation (Population) | 5.1% | 5.6% |
Demographics Similar to Trinidadians and Tobagonians and Barbadians by Poverty
In terms of poverty, the demographic groups most similar to Trinidadians and Tobagonians are Ottawa (14.3%, a difference of 0.010%), Mexican American Indian (14.3%, a difference of 0.040%), Immigrants from Ecuador (14.3%, a difference of 0.060%), Immigrants from Nicaragua (14.3%, a difference of 0.28%), and Cape Verdean (14.4%, a difference of 0.36%). Similarly, the demographic groups most similar to Barbadians are Immigrants from West Indies (14.8%, a difference of 0.040%), Spanish American (14.7%, a difference of 0.39%), Chickasaw (14.7%, a difference of 0.93%), Shoshone (14.7%, a difference of 0.97%), and Central American (14.6%, a difference of 1.6%).
| Demographics | Rating | Rank | Poverty |
| Immigrants | Ecuador | 0.1 /100 | #255 | Tragic 14.3% |
| Mexican American Indians | 0.1 /100 | #256 | Tragic 14.3% |
| Trinidadians and Tobagonians | 0.1 /100 | #257 | Tragic 14.3% |
| Ottawa | 0.1 /100 | #258 | Tragic 14.3% |
| Immigrants | Nicaragua | 0.1 /100 | #259 | Tragic 14.3% |
| Cape Verdeans | 0.1 /100 | #260 | Tragic 14.4% |
| Cherokee | 0.1 /100 | #261 | Tragic 14.4% |
| Immigrants | Liberia | 0.1 /100 | #262 | Tragic 14.4% |
| Jamaicans | 0.1 /100 | #263 | Tragic 14.4% |
| Immigrants | Jamaica | 0.1 /100 | #264 | Tragic 14.4% |
| Immigrants | Guyana | 0.1 /100 | #265 | Tragic 14.5% |
| Guyanese | 0.1 /100 | #266 | Tragic 14.5% |
| Iroquois | 0.1 /100 | #267 | Tragic 14.5% |
| Sub-Saharan Africans | 0.1 /100 | #268 | Tragic 14.5% |
| Immigrants | Cuba | 0.1 /100 | #269 | Tragic 14.6% |
| Central Americans | 0.1 /100 | #270 | Tragic 14.6% |
| Shoshone | 0.0 /100 | #271 | Tragic 14.7% |
| Chickasaw | 0.0 /100 | #272 | Tragic 14.7% |
| Spanish Americans | 0.0 /100 | #273 | Tragic 14.7% |
| Barbadians | 0.0 /100 | #274 | Tragic 14.8% |
| Immigrants | West Indies | 0.0 /100 | #275 | Tragic 14.8% |