Ethiopian vs Barbadian Unemployment Among Women with Children Under 18 years
COMPARE
Ethiopian
Barbadian
Unemployment Among Women with Children Under 18 years
Unemployment Among Women with Children Under 18 years Comparison
Ethiopians
Barbadians
5.3%
UNEMPLOYMENT AMONG WOMEN WITH CHILDREN UNDER 18 YEARS
80.7/ 100
METRIC RATING
133rd/ 347
METRIC RANK
6.4%
UNEMPLOYMENT AMONG WOMEN WITH CHILDREN UNDER 18 YEARS
0.0/ 100
METRIC RATING
295th/ 347
METRIC RANK
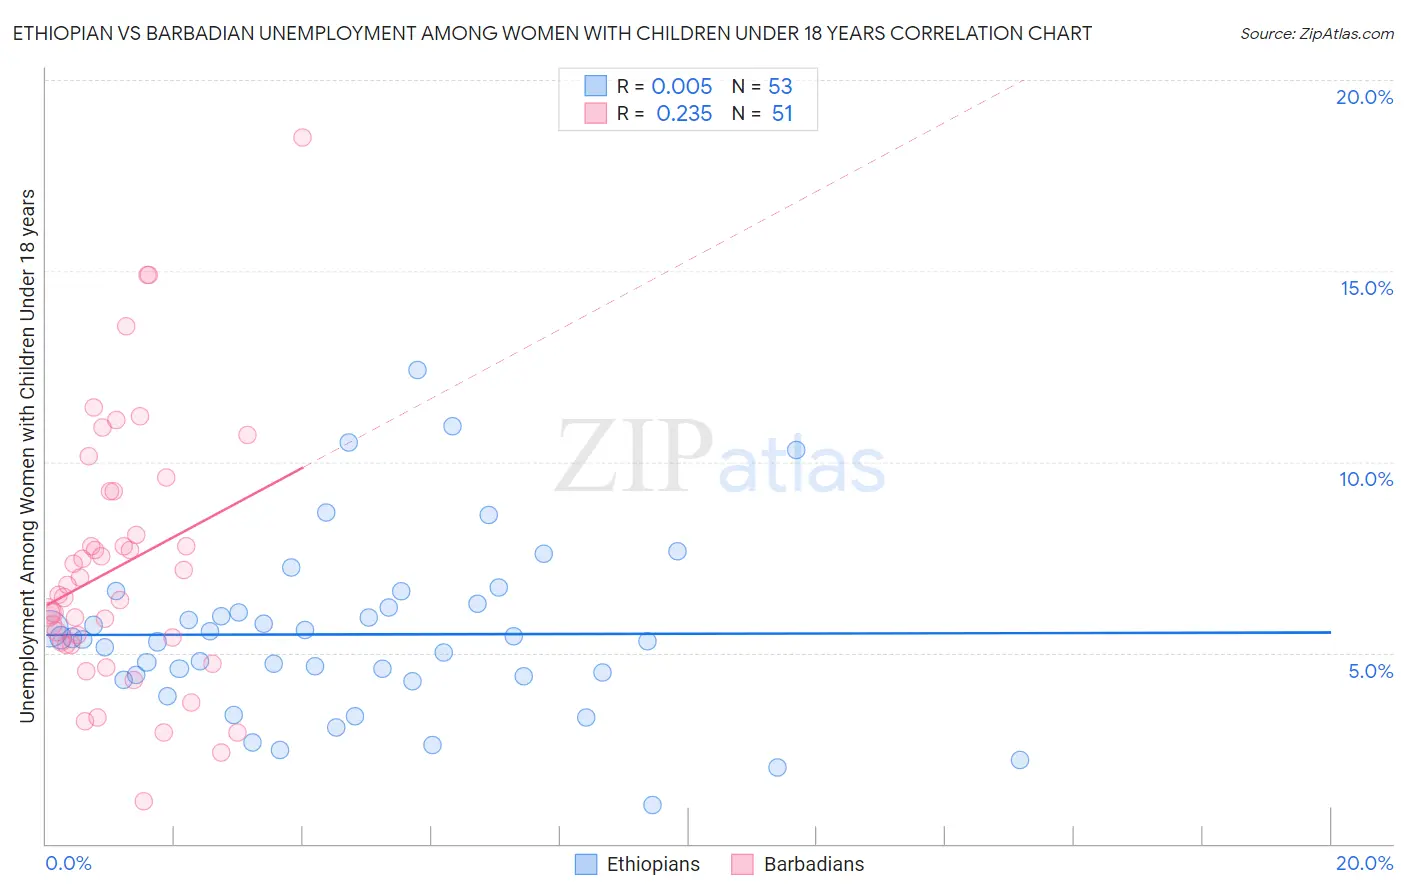
Ethiopian vs Barbadian Unemployment Among Women with Children Under 18 years Correlation Chart
The statistical analysis conducted on geographies consisting of 219,206,869 people shows no correlation between the proportion of Ethiopians and unemployment rate among women with children under the age of 18 in the United States with a correlation coefficient (R) of 0.005 and weighted average of 5.3%. Similarly, the statistical analysis conducted on geographies consisting of 139,822,827 people shows a weak positive correlation between the proportion of Barbadians and unemployment rate among women with children under the age of 18 in the United States with a correlation coefficient (R) of 0.235 and weighted average of 6.4%, a difference of 20.3%.
Unemployment Among Women with Children Under 18 years Correlation Summary
| Measurement | Ethiopian | Barbadian |
| Minimum | 1.0% | 1.1% |
| Maximum | 12.4% | 18.5% |
| Range | 11.4% | 17.4% |
| Mean | 5.5% | 7.3% |
| Median | 5.4% | 6.5% |
| Interquartile 25% (IQ1) | 4.4% | 5.2% |
| Interquartile 75% (IQ3) | 6.2% | 9.2% |
| Interquartile Range (IQR) | 1.9% | 4.0% |
| Standard Deviation (Sample) | 2.3% | 3.4% |
| Standard Deviation (Population) | 2.2% | 3.4% |
Similar Demographics by Unemployment Among Women with Children Under 18 years
Demographics Similar to Ethiopians by Unemployment Among Women with Children Under 18 years
In terms of unemployment among women with children under 18 years, the demographic groups most similar to Ethiopians are Slovak (5.3%, a difference of 0.020%), Immigrants from Ethiopia (5.3%, a difference of 0.080%), New Zealander (5.3%, a difference of 0.090%), Immigrants from Jordan (5.3%, a difference of 0.14%), and Immigrants from Israel (5.3%, a difference of 0.15%).
| Demographics | Rating | Rank | Unemployment Among Women with Children Under 18 years |
| Immigrants | Oceania | 83.1 /100 | #126 | Excellent 5.3% |
| Whites/Caucasians | 82.9 /100 | #127 | Excellent 5.3% |
| Immigrants | South Africa | 82.8 /100 | #128 | Excellent 5.3% |
| Immigrants | Italy | 82.3 /100 | #129 | Excellent 5.3% |
| Immigrants | Austria | 82.1 /100 | #130 | Excellent 5.3% |
| Immigrants | Israel | 81.9 /100 | #131 | Excellent 5.3% |
| Immigrants | Ethiopia | 81.4 /100 | #132 | Excellent 5.3% |
| Ethiopians | 80.7 /100 | #133 | Excellent 5.3% |
| Slovaks | 80.5 /100 | #134 | Excellent 5.3% |
| New Zealanders | 79.9 /100 | #135 | Good 5.3% |
| Immigrants | Jordan | 79.5 /100 | #136 | Good 5.3% |
| Jordanians | 78.8 /100 | #137 | Good 5.3% |
| Argentineans | 78.8 /100 | #138 | Good 5.3% |
| Immigrants | Ukraine | 78.5 /100 | #139 | Good 5.3% |
| Immigrants | Norway | 76.2 /100 | #140 | Good 5.3% |
Demographics Similar to Barbadians by Unemployment Among Women with Children Under 18 years
In terms of unemployment among women with children under 18 years, the demographic groups most similar to Barbadians are Haitian (6.4%, a difference of 0.020%), Immigrants from Senegal (6.4%, a difference of 0.060%), Honduran (6.4%, a difference of 0.080%), Immigrants from Bangladesh (6.4%, a difference of 0.11%), and Mexican (6.4%, a difference of 0.14%).
| Demographics | Rating | Rank | Unemployment Among Women with Children Under 18 years |
| Cree | 0.0 /100 | #288 | Tragic 6.3% |
| Immigrants | Caribbean | 0.0 /100 | #289 | Tragic 6.4% |
| Blackfeet | 0.0 /100 | #290 | Tragic 6.4% |
| Immigrants | Guatemala | 0.0 /100 | #291 | Tragic 6.4% |
| Mexicans | 0.0 /100 | #292 | Tragic 6.4% |
| Immigrants | Bangladesh | 0.0 /100 | #293 | Tragic 6.4% |
| Hondurans | 0.0 /100 | #294 | Tragic 6.4% |
| Barbadians | 0.0 /100 | #295 | Tragic 6.4% |
| Haitians | 0.0 /100 | #296 | Tragic 6.4% |
| Immigrants | Senegal | 0.0 /100 | #297 | Tragic 6.4% |
| Immigrants | Latin America | 0.0 /100 | #298 | Tragic 6.4% |
| Jamaicans | 0.0 /100 | #299 | Tragic 6.4% |
| Immigrants | Jamaica | 0.0 /100 | #300 | Tragic 6.4% |
| Immigrants | Haiti | 0.0 /100 | #301 | Tragic 6.4% |
| Immigrants | Armenia | 0.0 /100 | #302 | Tragic 6.5% |