Dominican vs Lebanese Single Female Poverty
COMPARE
Dominican
Lebanese
Single Female Poverty
Single Female Poverty Comparison
Dominicans
Lebanese
25.4%
SINGLE FEMALE POVERTY
0.0/ 100
METRIC RATING
309th/ 347
METRIC RANK
20.8%
SINGLE FEMALE POVERTY
67.6/ 100
METRIC RATING
163rd/ 347
METRIC RANK
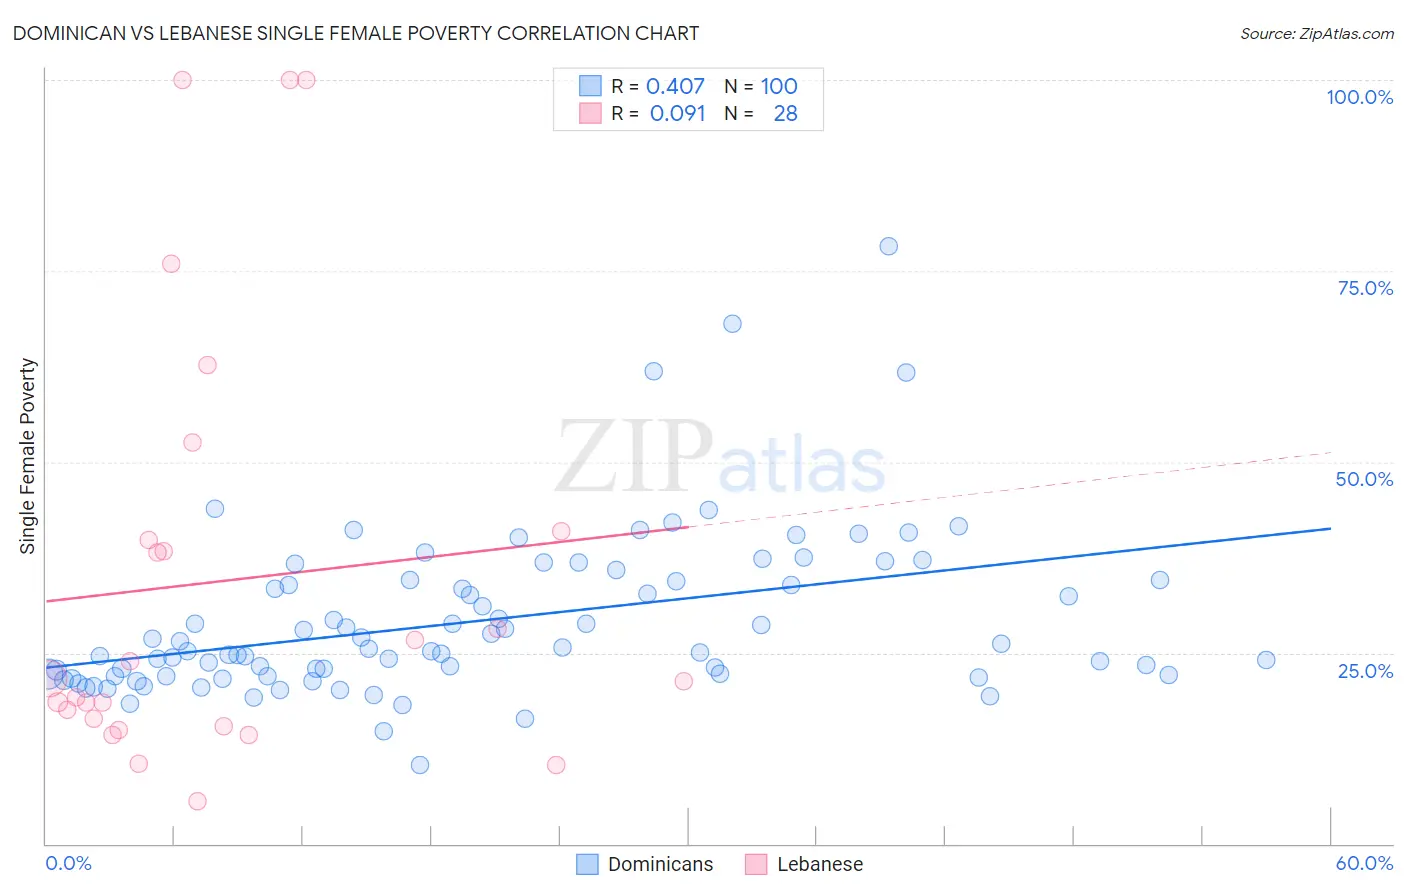
Dominican vs Lebanese Single Female Poverty Correlation Chart
The statistical analysis conducted on geographies consisting of 349,852,578 people shows a moderate positive correlation between the proportion of Dominicans and poverty level among single females in the United States with a correlation coefficient (R) of 0.407 and weighted average of 25.4%. Similarly, the statistical analysis conducted on geographies consisting of 394,403,389 people shows a slight positive correlation between the proportion of Lebanese and poverty level among single females in the United States with a correlation coefficient (R) of 0.091 and weighted average of 20.8%, a difference of 22.4%.
Single Female Poverty Correlation Summary
| Measurement | Dominican | Lebanese |
| Minimum | 10.3% | 5.5% |
| Maximum | 78.2% | 100.0% |
| Range | 67.9% | 94.5% |
| Mean | 29.2% | 34.4% |
| Median | 25.3% | 21.5% |
| Interquartile 25% (IQ1) | 22.1% | 15.8% |
| Interquartile 75% (IQ3) | 34.4% | 40.4% |
| Interquartile Range (IQR) | 12.4% | 24.6% |
| Standard Deviation (Sample) | 10.8% | 28.2% |
| Standard Deviation (Population) | 10.7% | 27.7% |
Similar Demographics by Single Female Poverty
Demographics Similar to Dominicans by Single Female Poverty
In terms of single female poverty, the demographic groups most similar to Dominicans are Aleut (25.4%, a difference of 0.010%), Central American Indian (25.5%, a difference of 0.15%), Potawatomi (25.4%, a difference of 0.18%), Immigrants from Mexico (25.3%, a difference of 0.41%), and Immigrants from Honduras (25.5%, a difference of 0.43%).
| Demographics | Rating | Rank | Single Female Poverty |
| Shoshone | 0.0 /100 | #302 | Tragic 25.1% |
| Somalis | 0.0 /100 | #303 | Tragic 25.2% |
| Immigrants | Congo | 0.0 /100 | #304 | Tragic 25.3% |
| Immigrants | Dominican Republic | 0.0 /100 | #305 | Tragic 25.3% |
| Immigrants | Mexico | 0.0 /100 | #306 | Tragic 25.3% |
| Potawatomi | 0.0 /100 | #307 | Tragic 25.4% |
| Aleuts | 0.0 /100 | #308 | Tragic 25.4% |
| Dominicans | 0.0 /100 | #309 | Tragic 25.4% |
| Central American Indians | 0.0 /100 | #310 | Tragic 25.5% |
| Immigrants | Honduras | 0.0 /100 | #311 | Tragic 25.5% |
| Paiute | 0.0 /100 | #312 | Tragic 25.5% |
| Comanche | 0.0 /100 | #313 | Tragic 25.6% |
| Cherokee | 0.0 /100 | #314 | Tragic 25.7% |
| Iroquois | 0.0 /100 | #315 | Tragic 25.7% |
| Immigrants | Somalia | 0.0 /100 | #316 | Tragic 25.8% |
Demographics Similar to Lebanese by Single Female Poverty
In terms of single female poverty, the demographic groups most similar to Lebanese are Northern European (20.8%, a difference of 0.050%), Kenyan (20.8%, a difference of 0.060%), Iraqi (20.8%, a difference of 0.22%), Arab (20.7%, a difference of 0.24%), and Ugandan (20.8%, a difference of 0.26%).
| Demographics | Rating | Rank | Single Female Poverty |
| South American Indians | 75.7 /100 | #156 | Good 20.6% |
| Immigrants | Oceania | 74.3 /100 | #157 | Good 20.7% |
| Danes | 73.0 /100 | #158 | Good 20.7% |
| Costa Ricans | 71.8 /100 | #159 | Good 20.7% |
| Arabs | 70.8 /100 | #160 | Good 20.7% |
| Kenyans | 68.5 /100 | #161 | Good 20.8% |
| Northern Europeans | 68.4 /100 | #162 | Good 20.8% |
| Lebanese | 67.6 /100 | #163 | Good 20.8% |
| Iraqis | 64.5 /100 | #164 | Good 20.8% |
| Ugandans | 64.0 /100 | #165 | Good 20.8% |
| Norwegians | 63.0 /100 | #166 | Good 20.8% |
| Immigrants | Norway | 63.0 /100 | #167 | Good 20.8% |
| Immigrants | Costa Rica | 61.5 /100 | #168 | Good 20.9% |
| Immigrants | Trinidad and Tobago | 56.3 /100 | #169 | Average 20.9% |
| New Zealanders | 53.2 /100 | #170 | Average 21.0% |