Dominican vs Serbian Single Female Poverty
COMPARE
Dominican
Serbian
Single Female Poverty
Single Female Poverty Comparison
Dominicans
Serbians
25.4%
SINGLE FEMALE POVERTY
0.0/ 100
METRIC RATING
309th/ 347
METRIC RANK
20.1%
SINGLE FEMALE POVERTY
93.3/ 100
METRIC RATING
126th/ 347
METRIC RANK
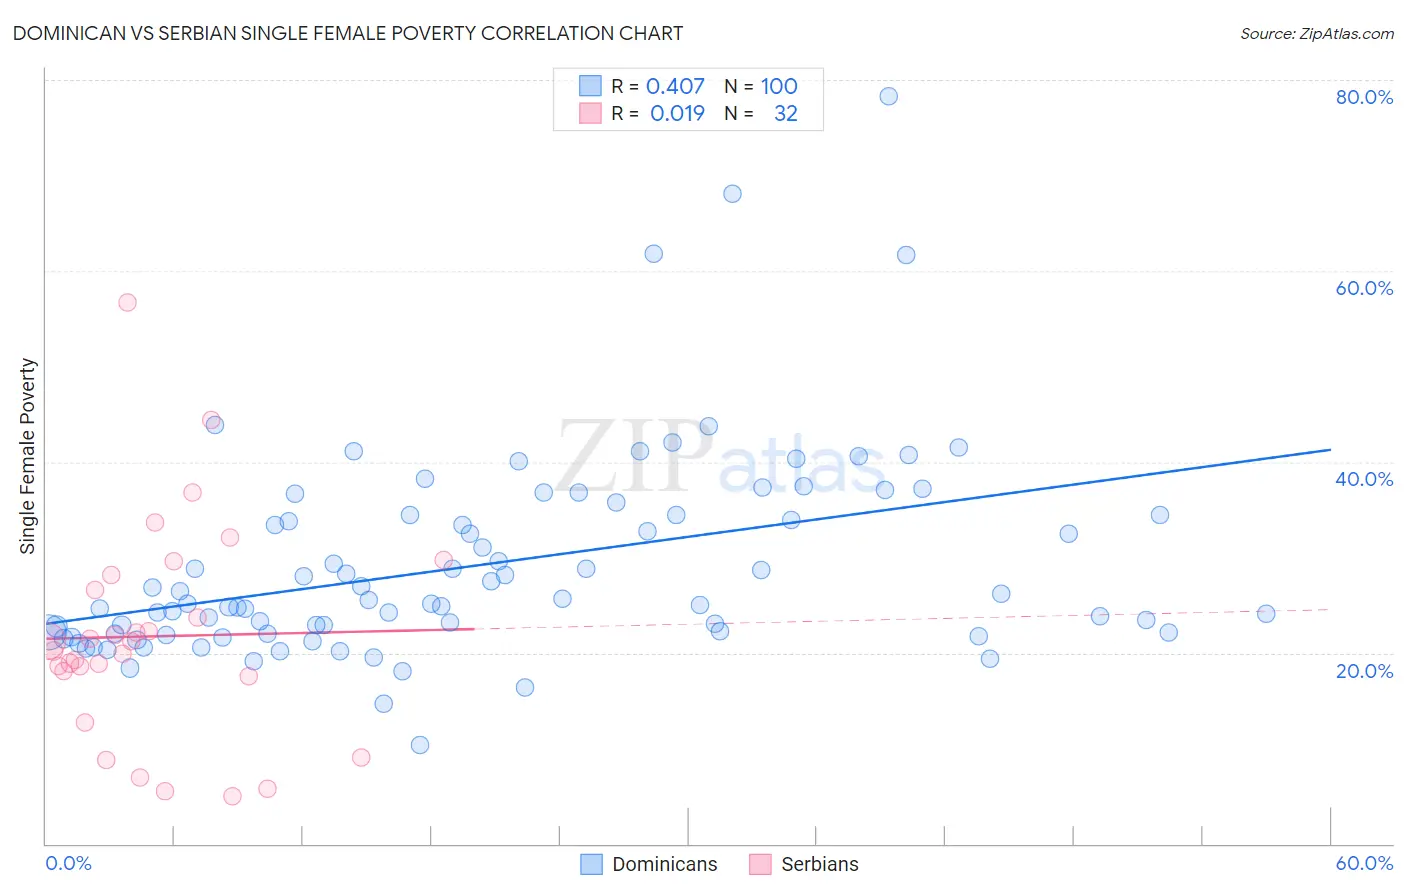
Dominican vs Serbian Single Female Poverty Correlation Chart
The statistical analysis conducted on geographies consisting of 349,852,578 people shows a moderate positive correlation between the proportion of Dominicans and poverty level among single females in the United States with a correlation coefficient (R) of 0.407 and weighted average of 25.4%. Similarly, the statistical analysis conducted on geographies consisting of 264,350,230 people shows no correlation between the proportion of Serbians and poverty level among single females in the United States with a correlation coefficient (R) of 0.019 and weighted average of 20.1%, a difference of 26.2%.
Single Female Poverty Correlation Summary
| Measurement | Dominican | Serbian |
| Minimum | 10.3% | 5.0% |
| Maximum | 78.2% | 56.7% |
| Range | 67.9% | 51.7% |
| Mean | 29.2% | 21.7% |
| Median | 25.3% | 20.7% |
| Interquartile 25% (IQ1) | 22.1% | 17.8% |
| Interquartile 75% (IQ3) | 34.4% | 27.4% |
| Interquartile Range (IQR) | 12.4% | 9.6% |
| Standard Deviation (Sample) | 10.8% | 11.2% |
| Standard Deviation (Population) | 10.7% | 11.1% |
Similar Demographics by Single Female Poverty
Demographics Similar to Dominicans by Single Female Poverty
In terms of single female poverty, the demographic groups most similar to Dominicans are Aleut (25.4%, a difference of 0.010%), Central American Indian (25.5%, a difference of 0.15%), Potawatomi (25.4%, a difference of 0.18%), Immigrants from Mexico (25.3%, a difference of 0.41%), and Immigrants from Honduras (25.5%, a difference of 0.43%).
| Demographics | Rating | Rank | Single Female Poverty |
| Shoshone | 0.0 /100 | #302 | Tragic 25.1% |
| Somalis | 0.0 /100 | #303 | Tragic 25.2% |
| Immigrants | Congo | 0.0 /100 | #304 | Tragic 25.3% |
| Immigrants | Dominican Republic | 0.0 /100 | #305 | Tragic 25.3% |
| Immigrants | Mexico | 0.0 /100 | #306 | Tragic 25.3% |
| Potawatomi | 0.0 /100 | #307 | Tragic 25.4% |
| Aleuts | 0.0 /100 | #308 | Tragic 25.4% |
| Dominicans | 0.0 /100 | #309 | Tragic 25.4% |
| Central American Indians | 0.0 /100 | #310 | Tragic 25.5% |
| Immigrants | Honduras | 0.0 /100 | #311 | Tragic 25.5% |
| Paiute | 0.0 /100 | #312 | Tragic 25.5% |
| Comanche | 0.0 /100 | #313 | Tragic 25.6% |
| Cherokee | 0.0 /100 | #314 | Tragic 25.7% |
| Iroquois | 0.0 /100 | #315 | Tragic 25.7% |
| Immigrants | Somalia | 0.0 /100 | #316 | Tragic 25.8% |
Demographics Similar to Serbians by Single Female Poverty
In terms of single female poverty, the demographic groups most similar to Serbians are Mongolian (20.2%, a difference of 0.020%), Immigrants from Spain (20.2%, a difference of 0.13%), Immigrants from South Africa (20.1%, a difference of 0.17%), Immigrants from Morocco (20.2%, a difference of 0.21%), and Immigrants from Hungary (20.2%, a difference of 0.23%).
| Demographics | Rating | Rank | Single Female Poverty |
| Immigrants | Ethiopia | 95.4 /100 | #119 | Exceptional 20.0% |
| South Americans | 95.1 /100 | #120 | Exceptional 20.0% |
| Immigrants | Switzerland | 95.1 /100 | #121 | Exceptional 20.0% |
| Immigrants | South America | 95.0 /100 | #122 | Exceptional 20.0% |
| Brazilians | 94.4 /100 | #123 | Exceptional 20.1% |
| Immigrants | Chile | 94.3 /100 | #124 | Exceptional 20.1% |
| Immigrants | South Africa | 93.9 /100 | #125 | Exceptional 20.1% |
| Serbians | 93.3 /100 | #126 | Exceptional 20.1% |
| Mongolians | 93.2 /100 | #127 | Exceptional 20.2% |
| Immigrants | Spain | 92.7 /100 | #128 | Exceptional 20.2% |
| Immigrants | Morocco | 92.4 /100 | #129 | Exceptional 20.2% |
| Immigrants | Hungary | 92.3 /100 | #130 | Exceptional 20.2% |
| Pakistanis | 92.1 /100 | #131 | Exceptional 20.2% |
| Uruguayans | 92.1 /100 | #132 | Exceptional 20.2% |
| Immigrants | England | 91.9 /100 | #133 | Exceptional 20.2% |