Dominican vs Russian Single Female Poverty
COMPARE
Dominican
Russian
Single Female Poverty
Single Female Poverty Comparison
Dominicans
Russians
25.4%
SINGLE FEMALE POVERTY
0.0/ 100
METRIC RATING
309th/ 347
METRIC RANK
19.2%
SINGLE FEMALE POVERTY
99.6/ 100
METRIC RATING
60th/ 347
METRIC RANK
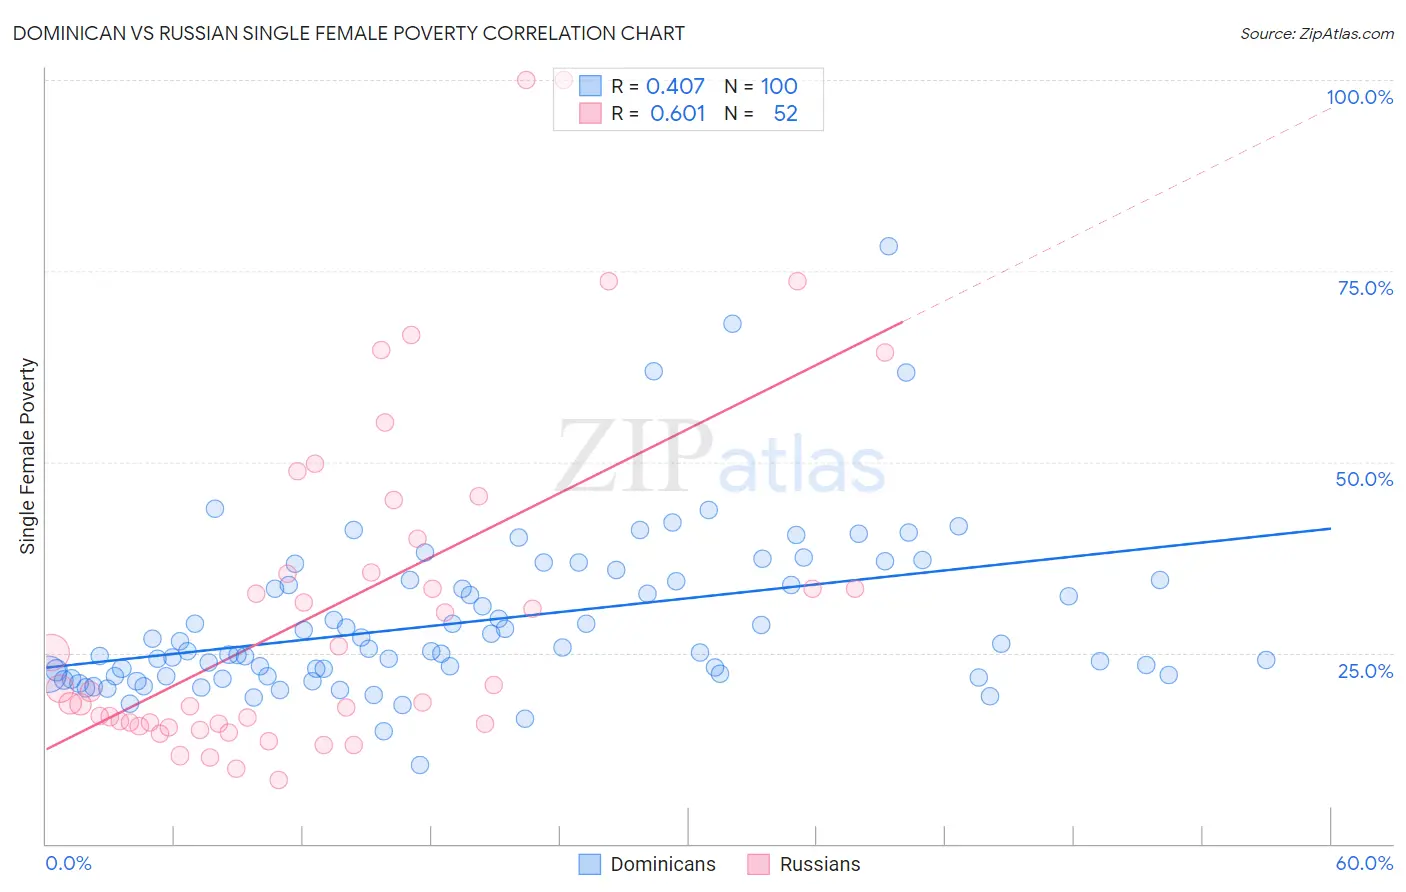
Dominican vs Russian Single Female Poverty Correlation Chart
The statistical analysis conducted on geographies consisting of 349,852,578 people shows a moderate positive correlation between the proportion of Dominicans and poverty level among single females in the United States with a correlation coefficient (R) of 0.407 and weighted average of 25.4%. Similarly, the statistical analysis conducted on geographies consisting of 497,545,833 people shows a significant positive correlation between the proportion of Russians and poverty level among single females in the United States with a correlation coefficient (R) of 0.601 and weighted average of 19.2%, a difference of 32.5%.
Single Female Poverty Correlation Summary
| Measurement | Dominican | Russian |
| Minimum | 10.3% | 8.3% |
| Maximum | 78.2% | 100.0% |
| Range | 67.9% | 91.7% |
| Mean | 29.2% | 31.0% |
| Median | 25.3% | 20.1% |
| Interquartile 25% (IQ1) | 22.1% | 15.7% |
| Interquartile 75% (IQ3) | 34.4% | 37.8% |
| Interquartile Range (IQR) | 12.4% | 22.1% |
| Standard Deviation (Sample) | 10.8% | 22.3% |
| Standard Deviation (Population) | 10.7% | 22.1% |
Similar Demographics by Single Female Poverty
Demographics Similar to Dominicans by Single Female Poverty
In terms of single female poverty, the demographic groups most similar to Dominicans are Aleut (25.4%, a difference of 0.010%), Central American Indian (25.5%, a difference of 0.15%), Potawatomi (25.4%, a difference of 0.18%), Immigrants from Mexico (25.3%, a difference of 0.41%), and Immigrants from Honduras (25.5%, a difference of 0.43%).
| Demographics | Rating | Rank | Single Female Poverty |
| Shoshone | 0.0 /100 | #302 | Tragic 25.1% |
| Somalis | 0.0 /100 | #303 | Tragic 25.2% |
| Immigrants | Congo | 0.0 /100 | #304 | Tragic 25.3% |
| Immigrants | Dominican Republic | 0.0 /100 | #305 | Tragic 25.3% |
| Immigrants | Mexico | 0.0 /100 | #306 | Tragic 25.3% |
| Potawatomi | 0.0 /100 | #307 | Tragic 25.4% |
| Aleuts | 0.0 /100 | #308 | Tragic 25.4% |
| Dominicans | 0.0 /100 | #309 | Tragic 25.4% |
| Central American Indians | 0.0 /100 | #310 | Tragic 25.5% |
| Immigrants | Honduras | 0.0 /100 | #311 | Tragic 25.5% |
| Paiute | 0.0 /100 | #312 | Tragic 25.5% |
| Comanche | 0.0 /100 | #313 | Tragic 25.6% |
| Cherokee | 0.0 /100 | #314 | Tragic 25.7% |
| Iroquois | 0.0 /100 | #315 | Tragic 25.7% |
| Immigrants | Somalia | 0.0 /100 | #316 | Tragic 25.8% |
Demographics Similar to Russians by Single Female Poverty
In terms of single female poverty, the demographic groups most similar to Russians are Cambodian (19.2%, a difference of 0.020%), Lithuanian (19.2%, a difference of 0.070%), Sri Lankan (19.2%, a difference of 0.10%), Immigrants from Northern Europe (19.2%, a difference of 0.19%), and Immigrants from Bulgaria (19.1%, a difference of 0.20%).
| Demographics | Rating | Rank | Single Female Poverty |
| Tsimshian | 99.7 /100 | #53 | Exceptional 19.1% |
| Argentineans | 99.7 /100 | #54 | Exceptional 19.1% |
| Immigrants | Vietnam | 99.7 /100 | #55 | Exceptional 19.1% |
| Immigrants | Fiji | 99.7 /100 | #56 | Exceptional 19.1% |
| Eastern Europeans | 99.7 /100 | #57 | Exceptional 19.1% |
| Immigrants | Bulgaria | 99.7 /100 | #58 | Exceptional 19.1% |
| Sri Lankans | 99.6 /100 | #59 | Exceptional 19.2% |
| Russians | 99.6 /100 | #60 | Exceptional 19.2% |
| Cambodians | 99.6 /100 | #61 | Exceptional 19.2% |
| Lithuanians | 99.6 /100 | #62 | Exceptional 19.2% |
| Immigrants | Northern Europe | 99.6 /100 | #63 | Exceptional 19.2% |
| Immigrants | Europe | 99.6 /100 | #64 | Exceptional 19.2% |
| Cypriots | 99.6 /100 | #65 | Exceptional 19.2% |
| Palestinians | 99.6 /100 | #66 | Exceptional 19.2% |
| Immigrants | Egypt | 99.6 /100 | #67 | Exceptional 19.2% |