Dominican vs Immigrants from Sierra Leone Divorced or Separated
COMPARE
Dominican
Immigrants from Sierra Leone
Divorced or Separated
Divorced or Separated Comparison
Dominicans
Immigrants from Sierra Leone
12.7%
DIVORCED OR SEPARATED
0.2/ 100
METRIC RATING
277th/ 347
METRIC RANK
12.1%
DIVORCED OR SEPARATED
50.0/ 100
METRIC RATING
175th/ 347
METRIC RANK
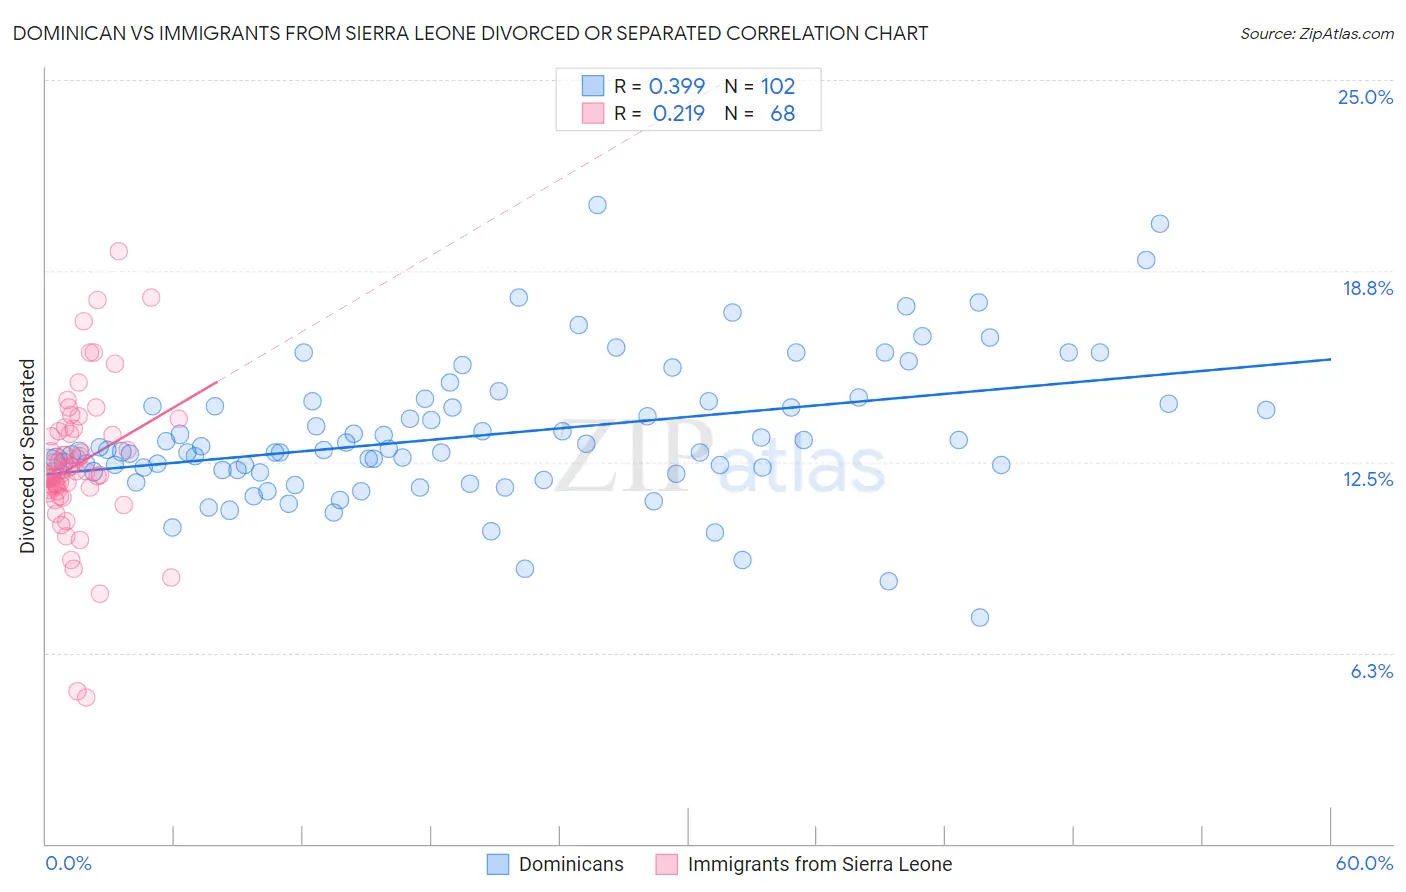
Dominican vs Immigrants from Sierra Leone Divorced or Separated Correlation Chart
The statistical analysis conducted on geographies consisting of 354,903,944 people shows a mild positive correlation between the proportion of Dominicans and percentage of population currently divorced or separated in the United States with a correlation coefficient (R) of 0.399 and weighted average of 12.7%. Similarly, the statistical analysis conducted on geographies consisting of 101,651,089 people shows a weak positive correlation between the proportion of Immigrants from Sierra Leone and percentage of population currently divorced or separated in the United States with a correlation coefficient (R) of 0.219 and weighted average of 12.1%, a difference of 5.3%.
Divorced or Separated Correlation Summary
| Measurement | Dominican | Immigrants from Sierra Leone |
| Minimum | 7.4% | 4.8% |
| Maximum | 20.9% | 19.4% |
| Range | 13.5% | 14.6% |
| Mean | 13.4% | 12.4% |
| Median | 12.9% | 12.2% |
| Interquartile 25% (IQ1) | 12.2% | 11.6% |
| Interquartile 75% (IQ3) | 14.4% | 13.5% |
| Interquartile Range (IQR) | 2.2% | 1.9% |
| Standard Deviation (Sample) | 2.3% | 2.4% |
| Standard Deviation (Population) | 2.3% | 2.4% |
Similar Demographics by Divorced or Separated
Demographics Similar to Dominicans by Divorced or Separated
In terms of divorced or separated, the demographic groups most similar to Dominicans are Spaniard (12.7%, a difference of 0.050%), Central American Indian (12.7%, a difference of 0.11%), Bermudan (12.7%, a difference of 0.14%), Immigrants from Micronesia (12.7%, a difference of 0.15%), and Lumbee (12.7%, a difference of 0.16%).
| Demographics | Rating | Rank | Divorced or Separated |
| Ute | 0.4 /100 | #270 | Tragic 12.6% |
| Panamanians | 0.3 /100 | #271 | Tragic 12.7% |
| Immigrants | Middle Africa | 0.3 /100 | #272 | Tragic 12.7% |
| Immigrants | Micronesia | 0.3 /100 | #273 | Tragic 12.7% |
| Bermudans | 0.3 /100 | #274 | Tragic 12.7% |
| Central American Indians | 0.3 /100 | #275 | Tragic 12.7% |
| Spaniards | 0.2 /100 | #276 | Tragic 12.7% |
| Dominicans | 0.2 /100 | #277 | Tragic 12.7% |
| Lumbee | 0.2 /100 | #278 | Tragic 12.7% |
| Immigrants | Dominican Republic | 0.2 /100 | #279 | Tragic 12.7% |
| Immigrants | Zaire | 0.2 /100 | #280 | Tragic 12.7% |
| Pueblo | 0.2 /100 | #281 | Tragic 12.7% |
| Sub-Saharan Africans | 0.1 /100 | #282 | Tragic 12.7% |
| Delaware | 0.1 /100 | #283 | Tragic 12.7% |
| Immigrants | Nonimmigrants | 0.1 /100 | #284 | Tragic 12.8% |
Demographics Similar to Immigrants from Sierra Leone by Divorced or Separated
In terms of divorced or separated, the demographic groups most similar to Immigrants from Sierra Leone are Hawaiian (12.1%, a difference of 0.0%), Immigrants from Moldova (12.1%, a difference of 0.020%), Pennsylvania German (12.1%, a difference of 0.040%), Brazilian (12.1%, a difference of 0.080%), and Immigrants from Mexico (12.0%, a difference of 0.11%).
| Demographics | Rating | Rank | Divorced or Separated |
| Serbians | 57.1 /100 | #168 | Average 12.0% |
| Immigrants | Peru | 57.0 /100 | #169 | Average 12.0% |
| Mexican American Indians | 55.8 /100 | #170 | Average 12.0% |
| Costa Ricans | 53.3 /100 | #171 | Average 12.0% |
| Immigrants | Mexico | 53.2 /100 | #172 | Average 12.0% |
| Immigrants | Moldova | 50.4 /100 | #173 | Average 12.1% |
| Hawaiians | 50.0 /100 | #174 | Average 12.1% |
| Immigrants | Sierra Leone | 50.0 /100 | #175 | Average 12.1% |
| Pennsylvania Germans | 48.9 /100 | #176 | Average 12.1% |
| Brazilians | 47.7 /100 | #177 | Average 12.1% |
| Ghanaians | 45.9 /100 | #178 | Average 12.1% |
| Immigrants | Western Europe | 45.6 /100 | #179 | Average 12.1% |
| Barbadians | 45.0 /100 | #180 | Average 12.1% |
| Immigrants | Canada | 44.0 /100 | #181 | Average 12.1% |
| Immigrants | Ethiopia | 43.1 /100 | #182 | Average 12.1% |