Dominican vs Immigrants from Zimbabwe Single Female Poverty
COMPARE
Dominican
Immigrants from Zimbabwe
Single Female Poverty
Single Female Poverty Comparison
Dominicans
Immigrants from Zimbabwe
25.4%
SINGLE FEMALE POVERTY
0.0/ 100
METRIC RATING
309th/ 347
METRIC RANK
20.0%
SINGLE FEMALE POVERTY
95.9/ 100
METRIC RATING
113th/ 347
METRIC RANK
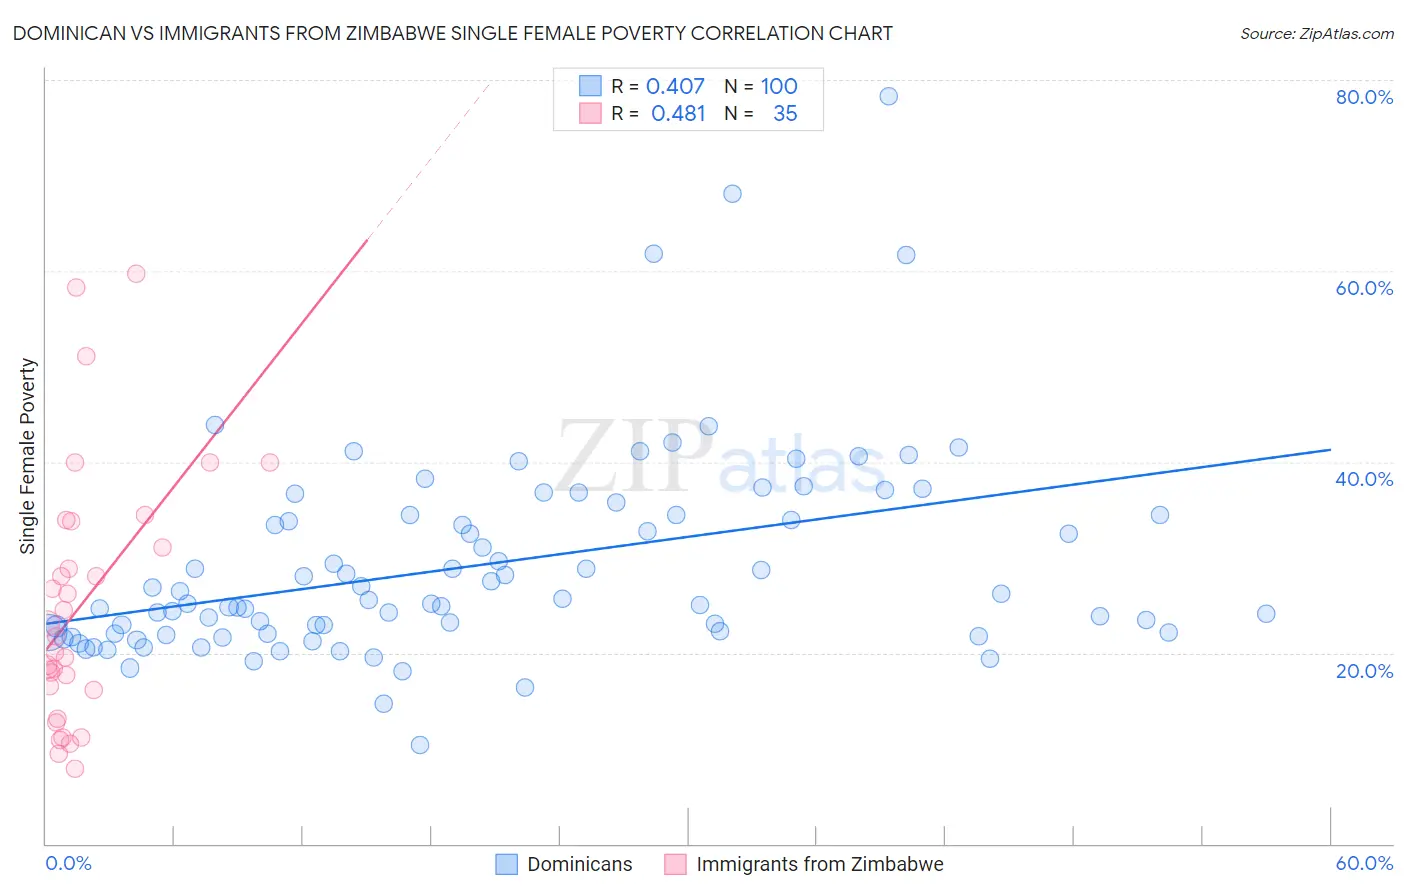
Dominican vs Immigrants from Zimbabwe Single Female Poverty Correlation Chart
The statistical analysis conducted on geographies consisting of 349,852,578 people shows a moderate positive correlation between the proportion of Dominicans and poverty level among single females in the United States with a correlation coefficient (R) of 0.407 and weighted average of 25.4%. Similarly, the statistical analysis conducted on geographies consisting of 117,320,666 people shows a moderate positive correlation between the proportion of Immigrants from Zimbabwe and poverty level among single females in the United States with a correlation coefficient (R) of 0.481 and weighted average of 20.0%, a difference of 27.2%.
Single Female Poverty Correlation Summary
| Measurement | Dominican | Immigrants from Zimbabwe |
| Minimum | 10.3% | 7.9% |
| Maximum | 78.2% | 59.7% |
| Range | 67.9% | 51.9% |
| Mean | 29.2% | 25.1% |
| Median | 25.3% | 21.7% |
| Interquartile 25% (IQ1) | 22.1% | 16.2% |
| Interquartile 75% (IQ3) | 34.4% | 33.7% |
| Interquartile Range (IQR) | 12.4% | 17.6% |
| Standard Deviation (Sample) | 10.8% | 13.4% |
| Standard Deviation (Population) | 10.7% | 13.2% |
Similar Demographics by Single Female Poverty
Demographics Similar to Dominicans by Single Female Poverty
In terms of single female poverty, the demographic groups most similar to Dominicans are Aleut (25.4%, a difference of 0.010%), Central American Indian (25.5%, a difference of 0.15%), Potawatomi (25.4%, a difference of 0.18%), Immigrants from Mexico (25.3%, a difference of 0.41%), and Immigrants from Honduras (25.5%, a difference of 0.43%).
| Demographics | Rating | Rank | Single Female Poverty |
| Shoshone | 0.0 /100 | #302 | Tragic 25.1% |
| Somalis | 0.0 /100 | #303 | Tragic 25.2% |
| Immigrants | Congo | 0.0 /100 | #304 | Tragic 25.3% |
| Immigrants | Dominican Republic | 0.0 /100 | #305 | Tragic 25.3% |
| Immigrants | Mexico | 0.0 /100 | #306 | Tragic 25.3% |
| Potawatomi | 0.0 /100 | #307 | Tragic 25.4% |
| Aleuts | 0.0 /100 | #308 | Tragic 25.4% |
| Dominicans | 0.0 /100 | #309 | Tragic 25.4% |
| Central American Indians | 0.0 /100 | #310 | Tragic 25.5% |
| Immigrants | Honduras | 0.0 /100 | #311 | Tragic 25.5% |
| Paiute | 0.0 /100 | #312 | Tragic 25.5% |
| Comanche | 0.0 /100 | #313 | Tragic 25.6% |
| Cherokee | 0.0 /100 | #314 | Tragic 25.7% |
| Iroquois | 0.0 /100 | #315 | Tragic 25.7% |
| Immigrants | Somalia | 0.0 /100 | #316 | Tragic 25.8% |
Demographics Similar to Immigrants from Zimbabwe by Single Female Poverty
In terms of single female poverty, the demographic groups most similar to Immigrants from Zimbabwe are Immigrants from Colombia (20.0%, a difference of 0.0%), Immigrants from Northern Africa (20.0%, a difference of 0.020%), Immigrants from Netherlands (20.0%, a difference of 0.050%), Immigrants from Kazakhstan (20.0%, a difference of 0.060%), and Polish (20.0%, a difference of 0.10%).
| Demographics | Rating | Rank | Single Female Poverty |
| Ethiopians | 96.7 /100 | #106 | Exceptional 19.9% |
| Immigrants | Syria | 96.7 /100 | #107 | Exceptional 19.9% |
| Native Hawaiians | 96.6 /100 | #108 | Exceptional 19.9% |
| Colombians | 96.6 /100 | #109 | Exceptional 19.9% |
| Immigrants | Western Asia | 96.5 /100 | #110 | Exceptional 19.9% |
| Carpatho Rusyns | 96.1 /100 | #111 | Exceptional 20.0% |
| Immigrants | Netherlands | 96.0 /100 | #112 | Exceptional 20.0% |
| Immigrants | Zimbabwe | 95.9 /100 | #113 | Exceptional 20.0% |
| Immigrants | Colombia | 95.9 /100 | #114 | Exceptional 20.0% |
| Immigrants | Northern Africa | 95.8 /100 | #115 | Exceptional 20.0% |
| Immigrants | Kazakhstan | 95.7 /100 | #116 | Exceptional 20.0% |
| Poles | 95.6 /100 | #117 | Exceptional 20.0% |
| Immigrants | Afghanistan | 95.4 /100 | #118 | Exceptional 20.0% |
| Immigrants | Ethiopia | 95.4 /100 | #119 | Exceptional 20.0% |
| South Americans | 95.1 /100 | #120 | Exceptional 20.0% |