Guatemalan vs Sri Lankan Female Poverty
COMPARE
Guatemalan
Sri Lankan
Female Poverty
Female Poverty Comparison
Guatemalans
Sri Lankans
16.7%
FEMALE POVERTY
0.0/ 100
METRIC RATING
301st/ 347
METRIC RANK
12.7%
FEMALE POVERTY
90.9/ 100
METRIC RATING
118th/ 347
METRIC RANK
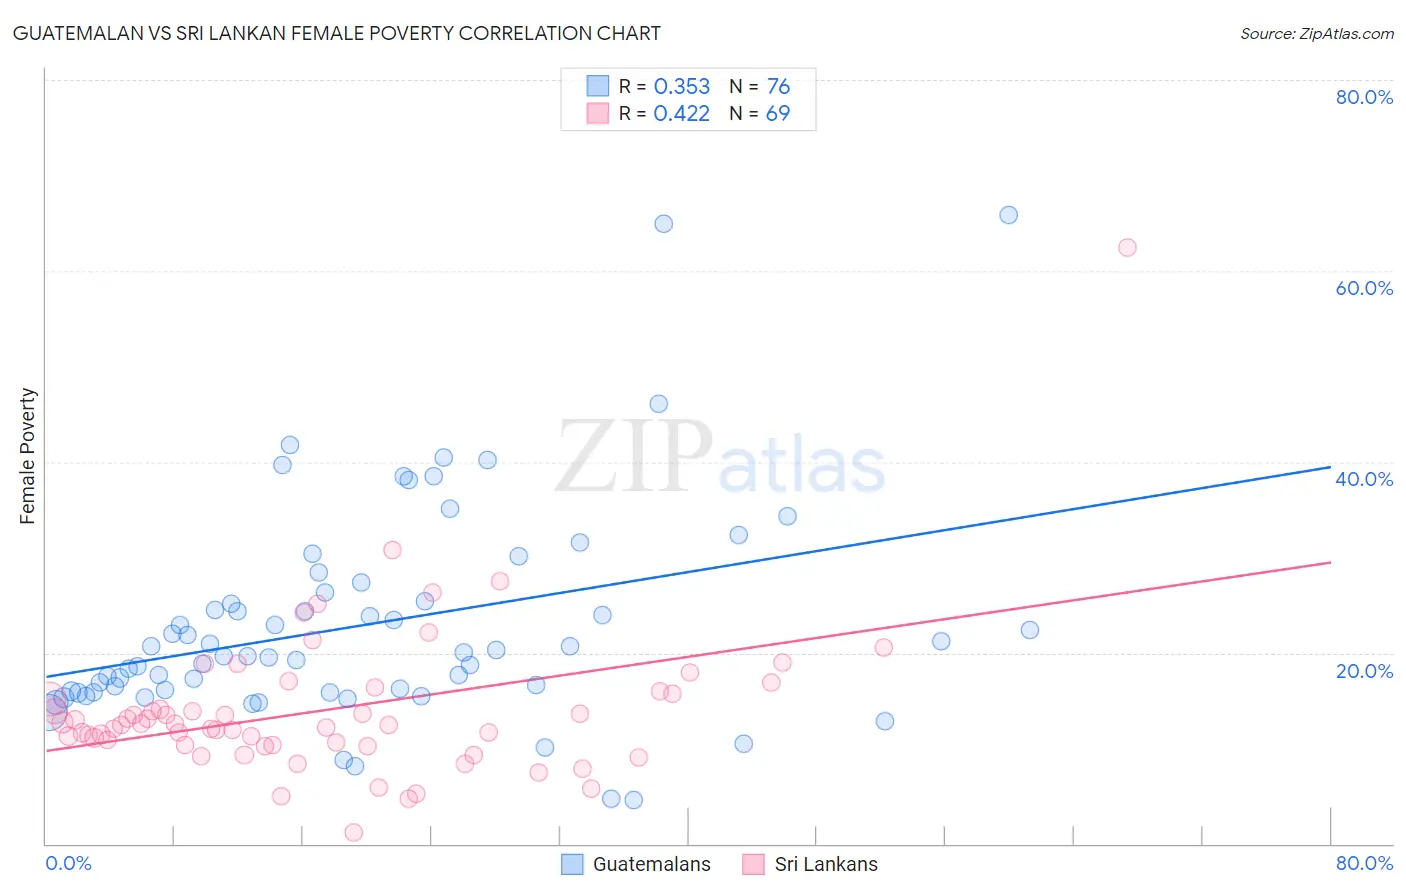
Guatemalan vs Sri Lankan Female Poverty Correlation Chart
The statistical analysis conducted on geographies consisting of 409,219,734 people shows a mild positive correlation between the proportion of Guatemalans and poverty level among females in the United States with a correlation coefficient (R) of 0.353 and weighted average of 16.7%. Similarly, the statistical analysis conducted on geographies consisting of 440,042,655 people shows a moderate positive correlation between the proportion of Sri Lankans and poverty level among females in the United States with a correlation coefficient (R) of 0.422 and weighted average of 12.7%, a difference of 31.5%.
Female Poverty Correlation Summary
| Measurement | Guatemalan | Sri Lankan |
| Minimum | 4.6% | 1.2% |
| Maximum | 65.8% | 62.5% |
| Range | 61.2% | 61.3% |
| Mean | 22.9% | 14.0% |
| Median | 19.8% | 12.5% |
| Interquartile 25% (IQ1) | 15.9% | 10.3% |
| Interquartile 75% (IQ3) | 25.8% | 15.8% |
| Interquartile Range (IQR) | 9.9% | 5.5% |
| Standard Deviation (Sample) | 11.3% | 8.1% |
| Standard Deviation (Population) | 11.2% | 8.0% |
Similar Demographics by Female Poverty
Demographics Similar to Guatemalans by Female Poverty
In terms of female poverty, the demographic groups most similar to Guatemalans are Chippewa (16.7%, a difference of 0.030%), Bahamian (16.6%, a difference of 0.33%), Hispanic or Latino (16.6%, a difference of 0.38%), Choctaw (16.8%, a difference of 0.63%), and Immigrants from Central America (16.8%, a difference of 0.70%).
| Demographics | Rating | Rank | Female Poverty |
| Immigrants | Cabo Verde | 0.0 /100 | #294 | Tragic 16.4% |
| Senegalese | 0.0 /100 | #295 | Tragic 16.5% |
| Immigrants | Senegal | 0.0 /100 | #296 | Tragic 16.5% |
| Mexicans | 0.0 /100 | #297 | Tragic 16.5% |
| Somalis | 0.0 /100 | #298 | Tragic 16.6% |
| Hispanics or Latinos | 0.0 /100 | #299 | Tragic 16.6% |
| Bahamians | 0.0 /100 | #300 | Tragic 16.6% |
| Guatemalans | 0.0 /100 | #301 | Tragic 16.7% |
| Chippewa | 0.0 /100 | #302 | Tragic 16.7% |
| Choctaw | 0.0 /100 | #303 | Tragic 16.8% |
| Immigrants | Central America | 0.0 /100 | #304 | Tragic 16.8% |
| Immigrants | Grenada | 0.0 /100 | #305 | Tragic 16.8% |
| Immigrants | Caribbean | 0.0 /100 | #306 | Tragic 16.9% |
| Seminole | 0.0 /100 | #307 | Tragic 16.9% |
| Africans | 0.0 /100 | #308 | Tragic 16.9% |
Demographics Similar to Sri Lankans by Female Poverty
In terms of female poverty, the demographic groups most similar to Sri Lankans are Albanian (12.7%, a difference of 0.010%), Immigrants from Southern Europe (12.7%, a difference of 0.020%), New Zealander (12.7%, a difference of 0.070%), Immigrants from Russia (12.7%, a difference of 0.090%), and Immigrants from Hungary (12.7%, a difference of 0.17%).
| Demographics | Rating | Rank | Female Poverty |
| Soviet Union | 92.4 /100 | #111 | Exceptional 12.6% |
| Immigrants | Israel | 92.0 /100 | #112 | Exceptional 12.6% |
| Canadians | 92.0 /100 | #113 | Exceptional 12.7% |
| Welsh | 91.6 /100 | #114 | Exceptional 12.7% |
| Puget Sound Salish | 91.5 /100 | #115 | Exceptional 12.7% |
| Immigrants | Russia | 91.2 /100 | #116 | Exceptional 12.7% |
| Immigrants | Southern Europe | 90.9 /100 | #117 | Exceptional 12.7% |
| Sri Lankans | 90.9 /100 | #118 | Exceptional 12.7% |
| Albanians | 90.8 /100 | #119 | Exceptional 12.7% |
| New Zealanders | 90.6 /100 | #120 | Exceptional 12.7% |
| Immigrants | Hungary | 90.3 /100 | #121 | Exceptional 12.7% |
| French Canadians | 90.2 /100 | #122 | Exceptional 12.7% |
| Immigrants | South Eastern Asia | 89.9 /100 | #123 | Excellent 12.7% |
| Immigrants | Norway | 89.3 /100 | #124 | Excellent 12.8% |
| Argentineans | 89.1 /100 | #125 | Excellent 12.8% |