Czechoslovakian vs Sri Lankan Disability Age 65 to 74
COMPARE
Czechoslovakian
Sri Lankan
Disability Age 65 to 74
Disability Age 65 to 74 Comparison
Czechoslovakians
Sri Lankans
23.0%
DISABILITY AGE 65 TO 74
72.4/ 100
METRIC RATING
157th/ 347
METRIC RANK
23.0%
DISABILITY AGE 65 TO 74
74.0/ 100
METRIC RATING
154th/ 347
METRIC RANK
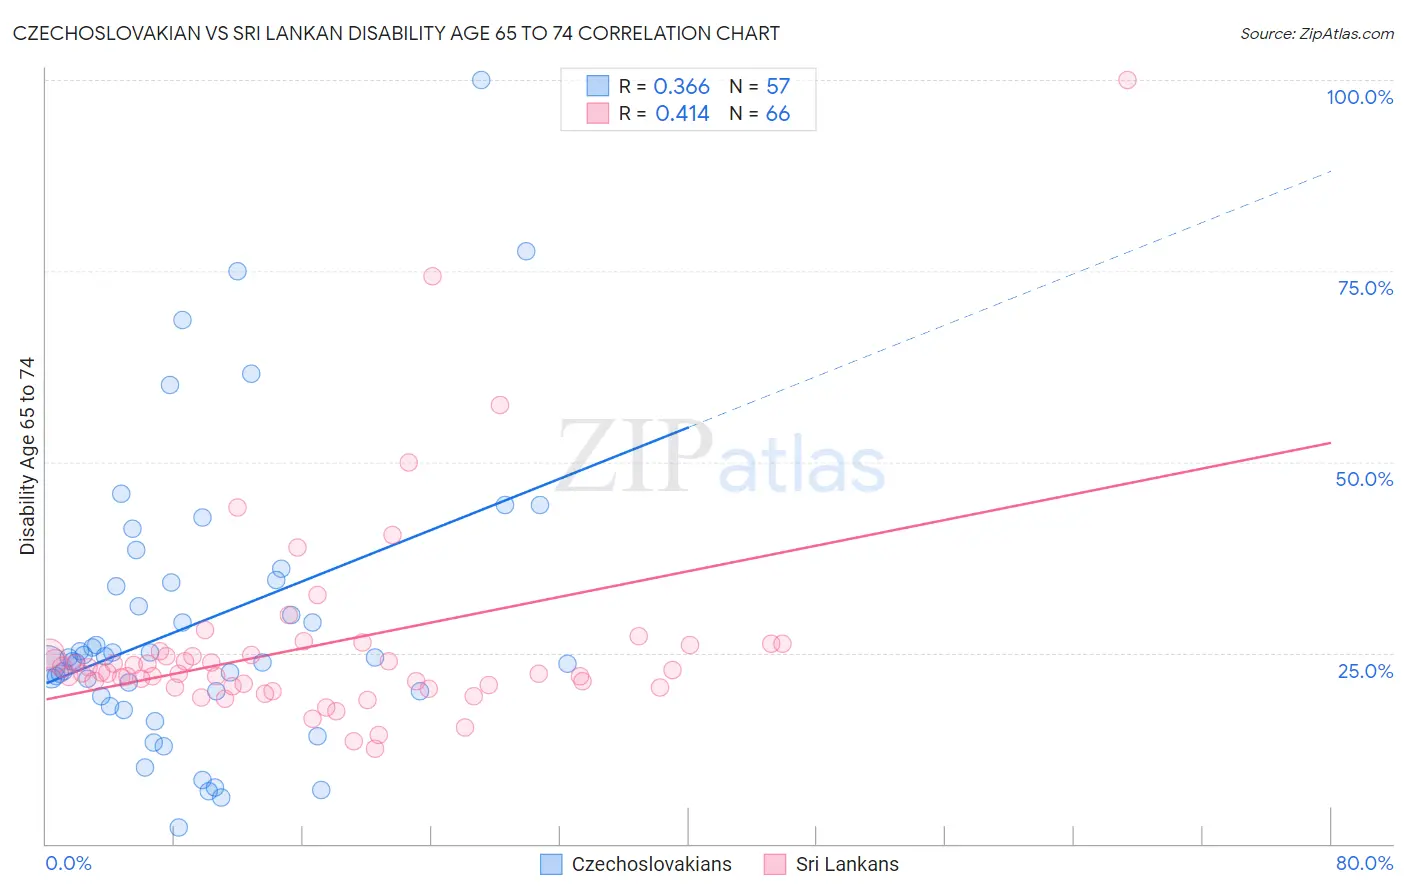
Czechoslovakian vs Sri Lankan Disability Age 65 to 74 Correlation Chart
The statistical analysis conducted on geographies consisting of 368,238,154 people shows a mild positive correlation between the proportion of Czechoslovakians and percentage of population with a disability between the ages 65 and 75 in the United States with a correlation coefficient (R) of 0.366 and weighted average of 23.0%. Similarly, the statistical analysis conducted on geographies consisting of 439,297,030 people shows a moderate positive correlation between the proportion of Sri Lankans and percentage of population with a disability between the ages 65 and 75 in the United States with a correlation coefficient (R) of 0.414 and weighted average of 23.0%, a difference of 0.12%.
Disability Age 65 to 74 Correlation Summary
| Measurement | Czechoslovakian | Sri Lankan |
| Minimum | 2.1% | 12.5% |
| Maximum | 100.0% | 100.0% |
| Range | 97.9% | 87.5% |
| Mean | 29.0% | 25.9% |
| Median | 24.3% | 22.4% |
| Interquartile 25% (IQ1) | 19.6% | 20.6% |
| Interquartile 75% (IQ3) | 34.3% | 25.1% |
| Interquartile Range (IQR) | 14.7% | 4.5% |
| Standard Deviation (Sample) | 18.9% | 13.4% |
| Standard Deviation (Population) | 18.7% | 13.3% |
Demographics Similar to Czechoslovakians and Sri Lankans by Disability Age 65 to 74
In terms of disability age 65 to 74, the demographic groups most similar to Czechoslovakians are British (23.0%, a difference of 0.11%), Immigrants from Western Asia (23.0%, a difference of 0.11%), Slavic (23.0%, a difference of 0.21%), Immigrants from Vietnam (23.1%, a difference of 0.23%), and Finnish (22.9%, a difference of 0.32%). Similarly, the demographic groups most similar to Sri Lankans are British (23.0%, a difference of 0.010%), Immigrants from Western Asia (23.0%, a difference of 0.010%), Slavic (23.0%, a difference of 0.090%), Finnish (22.9%, a difference of 0.20%), and Canadian (22.9%, a difference of 0.29%).
| Demographics | Rating | Rank | Disability Age 65 to 74 |
| Immigrants | Uganda | 84.0 /100 | #145 | Excellent 22.8% |
| Alsatians | 83.7 /100 | #146 | Excellent 22.8% |
| Immigrants | Uzbekistan | 83.1 /100 | #147 | Excellent 22.8% |
| New Zealanders | 79.9 /100 | #148 | Good 22.9% |
| Swiss | 79.7 /100 | #149 | Good 22.9% |
| Canadians | 77.7 /100 | #150 | Good 22.9% |
| Immigrants | Morocco | 77.6 /100 | #151 | Good 22.9% |
| Finns | 76.5 /100 | #152 | Good 22.9% |
| Slavs | 75.2 /100 | #153 | Good 23.0% |
| Sri Lankans | 74.0 /100 | #154 | Good 23.0% |
| British | 73.9 /100 | #155 | Good 23.0% |
| Immigrants | Western Asia | 73.8 /100 | #156 | Good 23.0% |
| Czechoslovakians | 72.4 /100 | #157 | Good 23.0% |
| Immigrants | Vietnam | 69.1 /100 | #158 | Good 23.1% |
| South American Indians | 65.5 /100 | #159 | Good 23.1% |
| Koreans | 64.2 /100 | #160 | Good 23.1% |
| Immigrants | Cameroon | 63.8 /100 | #161 | Good 23.1% |
| Europeans | 61.2 /100 | #162 | Good 23.2% |
| Immigrants | Philippines | 61.1 /100 | #163 | Good 23.2% |
| Sierra Leoneans | 60.9 /100 | #164 | Good 23.2% |
| Vietnamese | 60.8 /100 | #165 | Good 23.2% |