Cuban vs Immigrants from West Indies Family Poverty
COMPARE
Cuban
Immigrants from West Indies
Family Poverty
Family Poverty Comparison
Cubans
Immigrants from West Indies
10.6%
FAMILY POVERTY
0.4/ 100
METRIC RATING
249th/ 347
METRIC RANK
11.3%
FAMILY POVERTY
0.0/ 100
METRIC RATING
281st/ 347
METRIC RANK
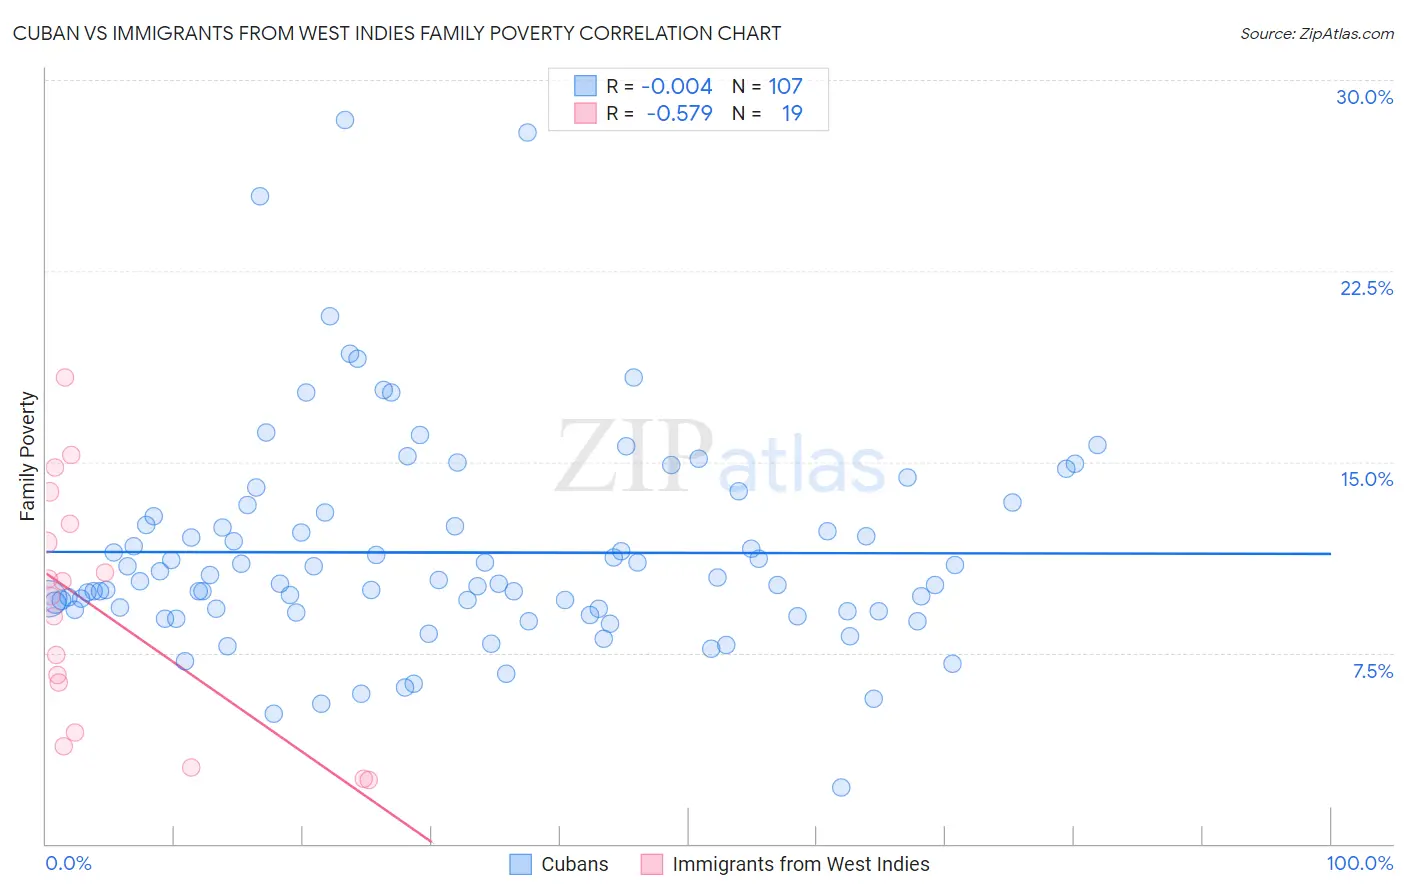
Cuban vs Immigrants from West Indies Family Poverty Correlation Chart
The statistical analysis conducted on geographies consisting of 447,916,186 people shows no correlation between the proportion of Cubans and poverty level among families in the United States with a correlation coefficient (R) of -0.004 and weighted average of 10.6%. Similarly, the statistical analysis conducted on geographies consisting of 72,448,648 people shows a substantial negative correlation between the proportion of Immigrants from West Indies and poverty level among families in the United States with a correlation coefficient (R) of -0.579 and weighted average of 11.3%, a difference of 6.2%.
Family Poverty Correlation Summary
| Measurement | Cuban | Immigrants from West Indies |
| Minimum | 2.2% | 2.5% |
| Maximum | 28.4% | 18.3% |
| Range | 26.2% | 15.8% |
| Mean | 11.4% | 9.1% |
| Median | 10.3% | 9.7% |
| Interquartile 25% (IQ1) | 9.1% | 4.4% |
| Interquartile 75% (IQ3) | 12.9% | 12.6% |
| Interquartile Range (IQR) | 3.8% | 8.2% |
| Standard Deviation (Sample) | 4.2% | 4.7% |
| Standard Deviation (Population) | 4.2% | 4.5% |
Similar Demographics by Family Poverty
Demographics Similar to Cubans by Family Poverty
In terms of family poverty, the demographic groups most similar to Cubans are Nicaraguan (10.6%, a difference of 0.050%), Liberian (10.6%, a difference of 0.25%), Cherokee (10.6%, a difference of 0.34%), Salvadoran (10.7%, a difference of 0.53%), and Iroquois (10.7%, a difference of 0.81%).
| Demographics | Rating | Rank | Family Poverty |
| Alaska Natives | 1.0 /100 | #242 | Tragic 10.4% |
| Nepalese | 0.8 /100 | #243 | Tragic 10.4% |
| Cree | 0.7 /100 | #244 | Tragic 10.5% |
| Immigrants | Burma/Myanmar | 0.6 /100 | #245 | Tragic 10.5% |
| Cherokee | 0.5 /100 | #246 | Tragic 10.6% |
| Liberians | 0.4 /100 | #247 | Tragic 10.6% |
| Nicaraguans | 0.4 /100 | #248 | Tragic 10.6% |
| Cubans | 0.4 /100 | #249 | Tragic 10.6% |
| Salvadorans | 0.3 /100 | #250 | Tragic 10.7% |
| Iroquois | 0.3 /100 | #251 | Tragic 10.7% |
| Immigrants | Zaire | 0.3 /100 | #252 | Tragic 10.7% |
| Immigrants | Western Africa | 0.3 /100 | #253 | Tragic 10.7% |
| Ecuadorians | 0.2 /100 | #254 | Tragic 10.8% |
| Immigrants | Liberia | 0.2 /100 | #255 | Tragic 10.8% |
| Chickasaw | 0.2 /100 | #256 | Tragic 10.8% |
Demographics Similar to Immigrants from West Indies by Family Poverty
In terms of family poverty, the demographic groups most similar to Immigrants from West Indies are Immigrants from Cuba (11.3%, a difference of 0.26%), Belizean (11.3%, a difference of 0.27%), Indonesian (11.3%, a difference of 0.30%), Blackfeet (11.3%, a difference of 0.31%), and Yaqui (11.3%, a difference of 0.42%).
| Demographics | Rating | Rank | Family Poverty |
| Spanish Americans | 0.1 /100 | #274 | Tragic 11.2% |
| Central Americans | 0.1 /100 | #275 | Tragic 11.2% |
| Immigrants | Guyana | 0.1 /100 | #276 | Tragic 11.2% |
| Chippewa | 0.1 /100 | #277 | Tragic 11.2% |
| Guyanese | 0.1 /100 | #278 | Tragic 11.2% |
| Blackfeet | 0.0 /100 | #279 | Tragic 11.3% |
| Belizeans | 0.0 /100 | #280 | Tragic 11.3% |
| Immigrants | West Indies | 0.0 /100 | #281 | Tragic 11.3% |
| Immigrants | Cuba | 0.0 /100 | #282 | Tragic 11.3% |
| Indonesians | 0.0 /100 | #283 | Tragic 11.3% |
| Yaqui | 0.0 /100 | #284 | Tragic 11.3% |
| Barbadians | 0.0 /100 | #285 | Tragic 11.3% |
| Senegalese | 0.0 /100 | #286 | Tragic 11.5% |
| Vietnamese | 0.0 /100 | #287 | Tragic 11.5% |
| Immigrants | Belize | 0.0 /100 | #288 | Tragic 11.5% |