Czechoslovakian vs Immigrants from West Indies Family Poverty

COMPARE

Czechoslovakian
Race
Ancestry
AfghanAfricanAlaska NativeAlaskan AthabascanAlbanianAleutAlsatianAmericanApacheArabArapahoArgentineanArmenianAssyrian/Chaldean/SyriacAustralianAustrianBahamianBangladeshiBarbadianBasqueBelgianBelizeanBermudanBhutaneseBlackfeetBolivianBrazilianBritishBritish West IndianBulgarianBurmeseCajunCambodianCanadianCape VerdeanCarpatho RusynCelticCentral AmericanCentral American IndianCherokeeCheyenneChickasawChileanChineseChippewaChoctawColombianColvilleComancheCosta RicanCreeCreekCroatianCrowCubanCypriotCzechCzechoslovakianDanishDelawareDominicanDutchDutch West IndianEastern EuropeanEcuadorianEgyptianEnglishEstonianEthiopianEuropeanFijianFilipinoFinnishFrenchFrench American IndianFrench CanadianGermanGerman RussianGhanaianGreekGuamanian/ChamorroGuatemalanGuyaneseHaitianHmongHonduranHopiHoumaHungarianIcelanderIndian (Asian)IndonesianInupiatIranianIraqiIrishIroquoisIsraeliItalianJamaicanJapaneseJordanianKenyanKiowaKoreanLaotianLatvianLebaneseLiberianLithuanianLumbeeLuxembourgerMacedonianMalaysianMalteseMarshalleseMenomineeMexicanMexican American IndianMongolianMoroccanNative HawaiianNavajoNepaleseNew ZealanderNicaraguanNigerianNorthern EuropeanNorwegianOkinawanOsageOttawaPaiutePakistaniPalestinianPanamanianParaguayanPennsylvania GermanPeruvianPimaPolishPortuguesePotawatomiPuebloPuerto RicanPuget Sound SalishRomanianRussianSalvadoranSamoanScandinavianScotch-IrishScottishSeminoleSenegaleseSerbianShoshoneSierra LeoneanSiouxSlavicSlovakSloveneSomaliSouth AfricanSouth AmericanSouth American IndianSoviet UnionSpaniardSpanishSpanish AmericanSpanish American IndianSri LankanSubsaharan AfricanSudaneseSwedishSwissSyrianTaiwaneseThaiTlingit-HaidaTohono O'OdhamTonganTrinidadian and TobagonianTsimshianTurkishU.S. Virgin IslanderUgandanUkrainianUruguayanUteVenezuelanVietnameseWelshWest IndianYakamaYaquiYugoslavianYumanYup'ikZimbabwean
Immigration
NonimmigrantsImmigrantsAfghanistanAfricaAlbaniaArgentinaArmeniaAsiaAustraliaAustriaBahamasBangladeshBarbadosBelarusBelgiumBelizeBoliviaBosnia and HerzegovinaBrazilBulgariaBurma/MyanmarCabo VerdeCambodiaCameroonCanadaCaribbeanCentral AmericaChileChinaColombiaCongoCosta RicaCroatiaCubaCzechoslovakiaDenmarkDominicaDominican RepublicEastern AfricaEastern AsiaEastern EuropeEcuadorEgyptEl SalvadorEnglandEritreaEthiopiaEuropeFijiFranceGermanyGhanaGreeceGrenadaGuatemalaGuyanaHaitiHondurasHong KongHungaryIndiaIndonesiaIranIraqIrelandIsraelItalyJamaicaJapanJordanKazakhstanKenyaKoreaKuwaitLaosLatin AmericaLatviaLebanonLiberiaLithuaniaMalaysiaMexicoMicronesiaMiddle AfricaMoldovaMoroccoNepalNetherlandsNicaraguaNigeriaNorth AmericaNorth MacedoniaNorthern AfricaNorthern EuropeNorwayOceaniaPakistanPanamaPeruPhilippinesPolandPortugalRomaniaRussiaSaudi ArabiaScotlandSenegalSerbiaSierra LeoneSingaporeSomaliaSouth AfricaSouth AmericaSouth Central AsiaSouth Eastern AsiaSouthern EuropeSpainSri LankaSt. Vincent and the GrenadinesSudanSwedenSwitzerlandSyriaTaiwanThailandTrinidad and TobagoTurkeyUgandaUkraineUruguayUzbekistanVenezuelaVietnamWestern AfricaWestern AsiaWestern EuropeYemenZaireZimbabweAzores
Immigrants from West Indies
Race
Ancestry
AfghanAfricanAlaska NativeAlaskan AthabascanAlbanianAleutAlsatianAmericanApacheArabArapahoArgentineanArmenianAssyrian/Chaldean/SyriacAustralianAustrianBahamianBangladeshiBarbadianBasqueBelgianBelizeanBermudanBhutaneseBlackfeetBolivianBrazilianBritishBritish West IndianBulgarianBurmeseCajunCambodianCanadianCape VerdeanCarpatho RusynCelticCentral AmericanCentral American IndianCherokeeCheyenneChickasawChileanChineseChippewaChoctawColombianColvilleComancheCosta RicanCreeCreekCroatianCrowCubanCypriotCzechDanishDelawareDominicanDutchDutch West IndianEastern EuropeanEcuadorianEgyptianEnglishEstonianEthiopianEuropeanFijianFilipinoFinnishFrenchFrench American IndianFrench CanadianGermanGerman RussianGhanaianGreekGuamanian/ChamorroGuatemalanGuyaneseHaitianHmongHonduranHopiHoumaHungarianIcelanderIndian (Asian)IndonesianInupiatIranianIraqiIrishIroquoisIsraeliItalianJamaicanJapaneseJordanianKenyanKiowaKoreanLaotianLatvianLebaneseLiberianLithuanianLumbeeLuxembourgerMacedonianMalaysianMalteseMarshalleseMenomineeMexicanMexican American IndianMongolianMoroccanNative HawaiianNavajoNepaleseNew ZealanderNicaraguanNigerianNorthern EuropeanNorwegianOkinawanOsageOttawaPaiutePakistaniPalestinianPanamanianParaguayanPennsylvania GermanPeruvianPimaPolishPortuguesePotawatomiPuebloPuerto RicanPuget Sound SalishRomanianRussianSalvadoranSamoanScandinavianScotch-IrishScottishSeminoleSenegaleseSerbianShoshoneSierra LeoneanSiouxSlavicSlovakSloveneSomaliSouth AfricanSouth AmericanSouth American IndianSoviet UnionSpaniardSpanishSpanish AmericanSpanish American IndianSri LankanSubsaharan AfricanSudaneseSwedishSwissSyrianTaiwaneseThaiTlingit-HaidaTohono O'OdhamTonganTrinidadian and TobagonianTsimshianTurkishU.S. Virgin IslanderUgandanUkrainianUruguayanUteVenezuelanVietnameseWelshWest IndianYakamaYaquiYugoslavianYumanYup'ikZimbabwean
Immigration
NonimmigrantsImmigrantsAfghanistanAfricaAlbaniaArgentinaArmeniaAsiaAustraliaAustriaBahamasBangladeshBarbadosBelarusBelgiumBelizeBoliviaBosnia and HerzegovinaBrazilBulgariaBurma/MyanmarCabo VerdeCambodiaCameroonCanadaCaribbeanCentral AmericaChileChinaColombiaCongoCosta RicaCroatiaCubaCzechoslovakiaDenmarkDominicaDominican RepublicEastern AfricaEastern AsiaEastern EuropeEcuadorEgyptEl SalvadorEnglandEritreaEthiopiaEuropeFijiFranceGermanyGhanaGreeceGrenadaGuatemalaGuyanaHaitiHondurasHong KongHungaryIndiaIndonesiaIranIraqIrelandIsraelItalyJamaicaJapanJordanKazakhstanKenyaKoreaKuwaitLaosLatin AmericaLatviaLebanonLiberiaLithuaniaMalaysiaMexicoMicronesiaMiddle AfricaMoldovaMoroccoNepalNetherlandsNicaraguaNigeriaNorth AmericaNorth MacedoniaNorthern AfricaNorthern EuropeNorwayOceaniaPakistanPanamaPeruPhilippinesPolandPortugalRomaniaRussiaSaudi ArabiaScotlandSenegalSerbiaSierra LeoneSingaporeSomaliaSouth AfricaSouth AmericaSouth Central AsiaSouth Eastern AsiaSouthern EuropeSpainSri LankaSt. Vincent and the GrenadinesSudanSwedenSwitzerlandSyriaTaiwanThailandTrinidad and TobagoTurkeyUgandaUkraineUruguayUzbekistanVenezuelaVietnamWest IndiesWestern AfricaWestern AsiaWestern EuropeYemenZaireZimbabweAzores
Family Poverty
Income
Poverty
Unemployment
Labor Participation
Family Structure
Vehicle Availability
Education Level
Disability

Family Poverty Comparison

Czechoslovakians

Immigrants from West Indies

Exceptional
Tragic
8.0%
FAMILY POVERTY
96.8/ 100
METRIC RATING
92nd/ 347
METRIC RANK
11.3%
FAMILY POVERTY
0.0/ 100
METRIC RATING
281st/ 347
METRIC RANK

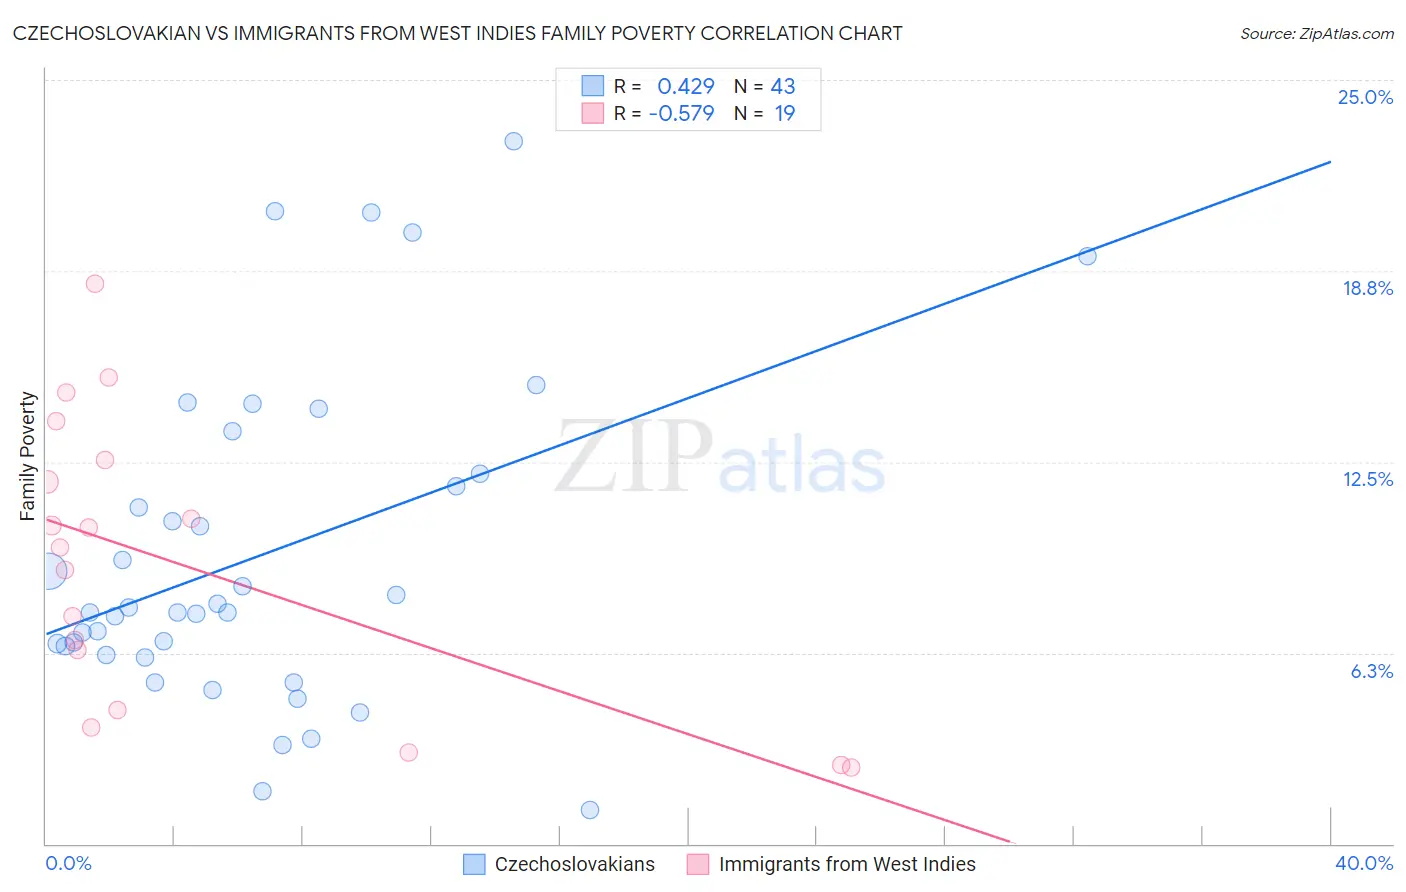
Czechoslovakian vs Immigrants from West Indies Family Poverty Correlation Chart

The statistical analysis conducted on geographies consisting of 367,669,162 people shows a moderate positive correlation between the proportion of Czechoslovakians and poverty level among families in the United States with a correlation coefficient (R) of 0.429 and weighted average of 8.0%. Similarly, the statistical analysis conducted on geographies consisting of 72,448,648 people shows a substantial negative correlation between the proportion of Immigrants from West Indies and poverty level among families in the United States with a correlation coefficient (R) of -0.579 and weighted average of 11.3%, a difference of 41.1%.
Czechoslovakian vs Immigrants from West Indies Family Poverty

Family Poverty Correlation Summary

MeasurementCzechoslovakianImmigrants from West Indies
Minimum1.1%2.5%
Maximum23.0%18.3%
Range21.9%15.8%
Mean9.4%9.1%
Median7.6%9.7%
Interquartile 25% (IQ1)6.2%4.4%
Interquartile 75% (IQ3)12.1%12.6%
Interquartile Range (IQR)5.9%8.2%
Standard Deviation (Sample)5.3%4.7%
Standard Deviation (Population)5.2%4.5%

Similar Demographics by Family Poverty

Demographics Similar to Czechoslovakians by Family Poverty

In terms of family poverty, the demographic groups most similar to Czechoslovakians are Tlingit-Haida (8.0%, a difference of 0.18%), Immigrants from Italy (8.0%, a difference of 0.24%), Immigrants from Pakistan (8.0%, a difference of 0.29%), Immigrants from Philippines (8.0%, a difference of 0.30%), and Immigrants from Turkey (8.0%, a difference of 0.32%).
DemographicsRating | RankFamily Poverty
Immigrants | Asia
97.4
/100
|
#85
Exceptional
7.9%
Scottish
97.3
/100
|
#86
Exceptional
7.9%
Belgians
97.3
/100
|
#87
Exceptional
8.0%
Serbians
97.2
/100
|
#88
Exceptional
8.0%
Immigrants | Denmark
97.1
/100
|
#89
Exceptional
8.0%
Immigrants | England
97.1
/100
|
#90
Exceptional
8.0%
Immigrants | Italy
97.0
/100
|
#91
Exceptional
8.0%
Czechoslovakians
96.8
/100
|
#92
Exceptional
8.0%
Tlingit-Haida
96.7
/100
|
#93
Exceptional
8.0%
Immigrants | Pakistan
96.6
/100
|
#94
Exceptional
8.0%
Immigrants | Philippines
96.5
/100
|
#95
Exceptional
8.0%
Immigrants | Turkey
96.5
/100
|
#96
Exceptional
8.0%
Immigrants | Switzerland
96.1
/100
|
#97
Exceptional
8.1%
Immigrants | South Africa
95.9
/100
|
#98
Exceptional
8.1%
Welsh
95.8
/100
|
#99
Exceptional
8.1%

Demographics Similar to Immigrants from West Indies by Family Poverty

In terms of family poverty, the demographic groups most similar to Immigrants from West Indies are Immigrants from Cuba (11.3%, a difference of 0.26%), Belizean (11.3%, a difference of 0.27%), Indonesian (11.3%, a difference of 0.30%), Blackfeet (11.3%, a difference of 0.31%), and Yaqui (11.3%, a difference of 0.42%).
DemographicsRating | RankFamily Poverty
Spanish Americans
0.1
/100
|
#274
Tragic
11.2%
Central Americans
0.1
/100
|
#275
Tragic
11.2%
Immigrants | Guyana
0.1
/100
|
#276
Tragic
11.2%
Chippewa
0.1
/100
|
#277
Tragic
11.2%
Guyanese
0.1
/100
|
#278
Tragic
11.2%
Blackfeet
0.0
/100
|
#279
Tragic
11.3%
Belizeans
0.0
/100
|
#280
Tragic
11.3%
Immigrants | West Indies
0.0
/100
|
#281
Tragic
11.3%
Immigrants | Cuba
0.0
/100
|
#282
Tragic
11.3%
Indonesians
0.0
/100
|
#283
Tragic
11.3%
Yaqui
0.0
/100
|
#284
Tragic
11.3%
Barbadians
0.0
/100
|
#285
Tragic
11.3%
Senegalese
0.0
/100
|
#286
Tragic
11.5%
Vietnamese
0.0
/100
|
#287
Tragic
11.5%
Immigrants | Belize
0.0
/100
|
#288
Tragic
11.5%