Cuban vs Immigrants from West Indies Child Poverty Among Boys Under 16
COMPARE
Cuban
Immigrants from West Indies
Child Poverty Among Boys Under 16
Child Poverty Among Boys Under 16 Comparison
Cubans
Immigrants from West Indies
17.9%
CHILD POVERTY AMONG BOYS UNDER 16
3.8/ 100
METRIC RATING
223rd/ 347
METRIC RANK
20.0%
CHILD POVERTY AMONG BOYS UNDER 16
0.0/ 100
METRIC RATING
278th/ 347
METRIC RANK
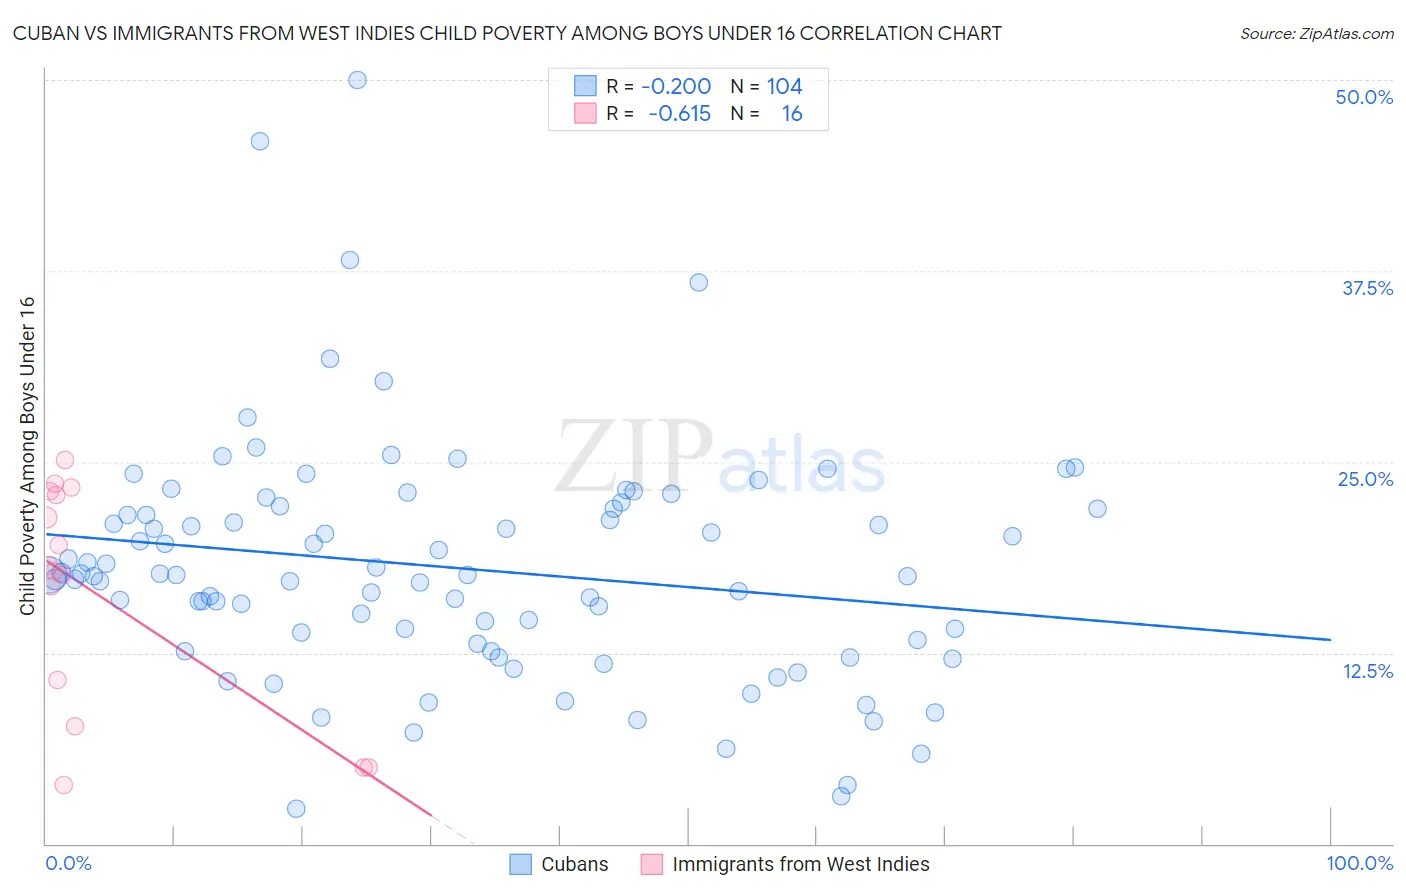
Cuban vs Immigrants from West Indies Child Poverty Among Boys Under 16 Correlation Chart
The statistical analysis conducted on geographies consisting of 441,055,508 people shows a poor negative correlation between the proportion of Cubans and poverty level among boys under the age of 16 in the United States with a correlation coefficient (R) of -0.200 and weighted average of 17.9%. Similarly, the statistical analysis conducted on geographies consisting of 72,283,837 people shows a significant negative correlation between the proportion of Immigrants from West Indies and poverty level among boys under the age of 16 in the United States with a correlation coefficient (R) of -0.615 and weighted average of 20.0%, a difference of 11.7%.
Child Poverty Among Boys Under 16 Correlation Summary
| Measurement | Cuban | Immigrants from West Indies |
| Minimum | 2.3% | 3.9% |
| Maximum | 50.0% | 25.1% |
| Range | 47.7% | 21.2% |
| Mean | 18.1% | 16.3% |
| Median | 17.6% | 18.0% |
| Interquartile 25% (IQ1) | 13.2% | 9.2% |
| Interquartile 75% (IQ3) | 21.9% | 22.9% |
| Interquartile Range (IQR) | 8.7% | 13.8% |
| Standard Deviation (Sample) | 7.7% | 7.4% |
| Standard Deviation (Population) | 7.7% | 7.2% |
Similar Demographics by Child Poverty Among Boys Under 16
Demographics Similar to Cubans by Child Poverty Among Boys Under 16
In terms of child poverty among boys under 16, the demographic groups most similar to Cubans are Pennsylvania German (17.9%, a difference of 0.090%), Immigrants from Panama (17.9%, a difference of 0.32%), Nepalese (18.0%, a difference of 0.47%), Immigrants from Cambodia (17.8%, a difference of 0.79%), and Inupiat (18.1%, a difference of 0.89%).
| Demographics | Rating | Rank | Child Poverty Among Boys Under 16 |
| Moroccans | 5.6 /100 | #216 | Tragic 17.7% |
| Japanese | 5.5 /100 | #217 | Tragic 17.7% |
| Iraqis | 5.5 /100 | #218 | Tragic 17.7% |
| Sierra Leoneans | 5.3 /100 | #219 | Tragic 17.8% |
| Immigrants | Cambodia | 5.1 /100 | #220 | Tragic 17.8% |
| Immigrants | Panama | 4.3 /100 | #221 | Tragic 17.9% |
| Pennsylvania Germans | 3.9 /100 | #222 | Tragic 17.9% |
| Cubans | 3.8 /100 | #223 | Tragic 17.9% |
| Nepalese | 3.2 /100 | #224 | Tragic 18.0% |
| Inupiat | 2.7 /100 | #225 | Tragic 18.1% |
| Immigrants | Africa | 2.6 /100 | #226 | Tragic 18.1% |
| Bermudans | 2.5 /100 | #227 | Tragic 18.1% |
| Immigrants | Nonimmigrants | 2.2 /100 | #228 | Tragic 18.2% |
| Immigrants | Micronesia | 1.8 /100 | #229 | Tragic 18.3% |
| Fijians | 1.8 /100 | #230 | Tragic 18.3% |
Demographics Similar to Immigrants from West Indies by Child Poverty Among Boys Under 16
In terms of child poverty among boys under 16, the demographic groups most similar to Immigrants from West Indies are Immigrants from Barbados (20.0%, a difference of 0.020%), Subsaharan African (20.0%, a difference of 0.12%), Bangladeshi (20.0%, a difference of 0.13%), Central American (20.1%, a difference of 0.25%), and Jamaican (20.0%, a difference of 0.29%).
| Demographics | Rating | Rank | Child Poverty Among Boys Under 16 |
| Chickasaw | 0.1 /100 | #271 | Tragic 19.8% |
| Immigrants | Ecuador | 0.1 /100 | #272 | Tragic 19.8% |
| Belizeans | 0.1 /100 | #273 | Tragic 19.9% |
| Immigrants | Bangladesh | 0.0 /100 | #274 | Tragic 19.9% |
| Jamaicans | 0.0 /100 | #275 | Tragic 20.0% |
| Sub-Saharan Africans | 0.0 /100 | #276 | Tragic 20.0% |
| Immigrants | Barbados | 0.0 /100 | #277 | Tragic 20.0% |
| Immigrants | West Indies | 0.0 /100 | #278 | Tragic 20.0% |
| Bangladeshis | 0.0 /100 | #279 | Tragic 20.0% |
| Central Americans | 0.0 /100 | #280 | Tragic 20.1% |
| Immigrants | Zaire | 0.0 /100 | #281 | Tragic 20.1% |
| Comanche | 0.0 /100 | #282 | Tragic 20.1% |
| Immigrants | Jamaica | 0.0 /100 | #283 | Tragic 20.1% |
| Barbadians | 0.0 /100 | #284 | Tragic 20.2% |
| Arapaho | 0.0 /100 | #285 | Tragic 20.2% |