Cree vs Immigrants from West Indies Family Poverty
COMPARE
Cree
Immigrants from West Indies
Family Poverty
Family Poverty Comparison
Cree
Immigrants from West Indies
10.5%
FAMILY POVERTY
0.7/ 100
METRIC RATING
244th/ 347
METRIC RANK
11.3%
FAMILY POVERTY
0.0/ 100
METRIC RATING
281st/ 347
METRIC RANK
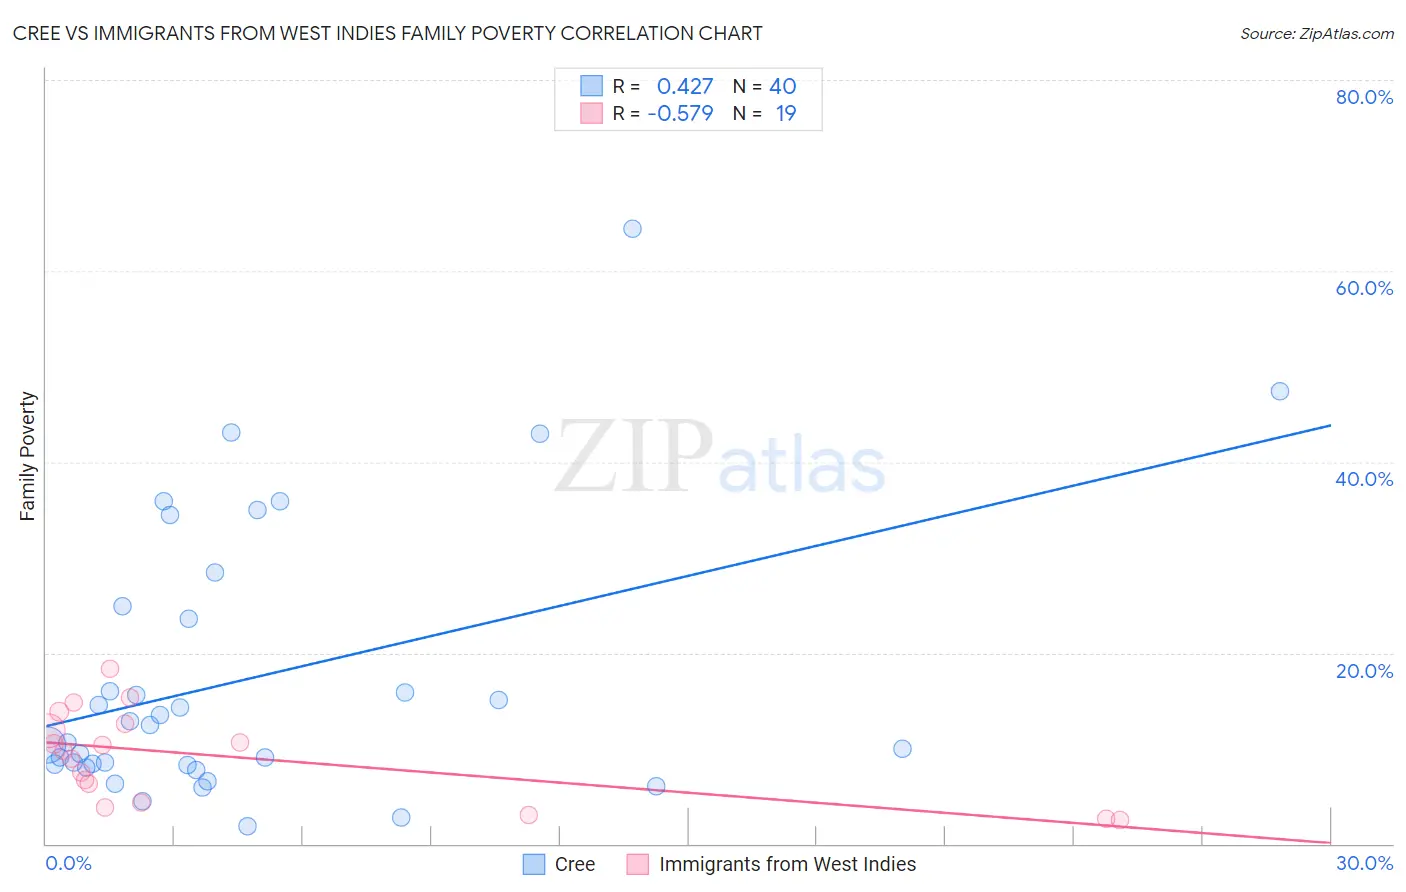
Cree vs Immigrants from West Indies Family Poverty Correlation Chart
The statistical analysis conducted on geographies consisting of 76,172,191 people shows a moderate positive correlation between the proportion of Cree and poverty level among families in the United States with a correlation coefficient (R) of 0.427 and weighted average of 10.5%. Similarly, the statistical analysis conducted on geographies consisting of 72,448,648 people shows a substantial negative correlation between the proportion of Immigrants from West Indies and poverty level among families in the United States with a correlation coefficient (R) of -0.579 and weighted average of 11.3%, a difference of 7.9%.
Family Poverty Correlation Summary
| Measurement | Cree | Immigrants from West Indies |
| Minimum | 1.8% | 2.5% |
| Maximum | 64.4% | 18.3% |
| Range | 62.6% | 15.8% |
| Mean | 17.4% | 9.1% |
| Median | 11.6% | 9.7% |
| Interquartile 25% (IQ1) | 8.3% | 4.4% |
| Interquartile 75% (IQ3) | 24.2% | 12.6% |
| Interquartile Range (IQR) | 16.0% | 8.2% |
| Standard Deviation (Sample) | 14.4% | 4.7% |
| Standard Deviation (Population) | 14.2% | 4.5% |
Similar Demographics by Family Poverty
Demographics Similar to Cree by Family Poverty
In terms of family poverty, the demographic groups most similar to Cree are Nepalese (10.4%, a difference of 0.46%), Immigrants from Burma/Myanmar (10.5%, a difference of 0.61%), Alaska Native (10.4%, a difference of 0.94%), Cherokee (10.6%, a difference of 1.3%), and Liberian (10.6%, a difference of 1.3%).
| Demographics | Rating | Rank | Family Poverty |
| Immigrants | Laos | 1.7 /100 | #237 | Tragic 10.2% |
| French American Indians | 1.5 /100 | #238 | Tragic 10.2% |
| Potawatomi | 1.5 /100 | #239 | Tragic 10.2% |
| Immigrants | Azores | 1.4 /100 | #240 | Tragic 10.3% |
| Ghanaians | 1.3 /100 | #241 | Tragic 10.3% |
| Alaska Natives | 1.0 /100 | #242 | Tragic 10.4% |
| Nepalese | 0.8 /100 | #243 | Tragic 10.4% |
| Cree | 0.7 /100 | #244 | Tragic 10.5% |
| Immigrants | Burma/Myanmar | 0.6 /100 | #245 | Tragic 10.5% |
| Cherokee | 0.5 /100 | #246 | Tragic 10.6% |
| Liberians | 0.4 /100 | #247 | Tragic 10.6% |
| Nicaraguans | 0.4 /100 | #248 | Tragic 10.6% |
| Cubans | 0.4 /100 | #249 | Tragic 10.6% |
| Salvadorans | 0.3 /100 | #250 | Tragic 10.7% |
| Iroquois | 0.3 /100 | #251 | Tragic 10.7% |
Demographics Similar to Immigrants from West Indies by Family Poverty
In terms of family poverty, the demographic groups most similar to Immigrants from West Indies are Immigrants from Cuba (11.3%, a difference of 0.26%), Belizean (11.3%, a difference of 0.27%), Indonesian (11.3%, a difference of 0.30%), Blackfeet (11.3%, a difference of 0.31%), and Yaqui (11.3%, a difference of 0.42%).
| Demographics | Rating | Rank | Family Poverty |
| Spanish Americans | 0.1 /100 | #274 | Tragic 11.2% |
| Central Americans | 0.1 /100 | #275 | Tragic 11.2% |
| Immigrants | Guyana | 0.1 /100 | #276 | Tragic 11.2% |
| Chippewa | 0.1 /100 | #277 | Tragic 11.2% |
| Guyanese | 0.1 /100 | #278 | Tragic 11.2% |
| Blackfeet | 0.0 /100 | #279 | Tragic 11.3% |
| Belizeans | 0.0 /100 | #280 | Tragic 11.3% |
| Immigrants | West Indies | 0.0 /100 | #281 | Tragic 11.3% |
| Immigrants | Cuba | 0.0 /100 | #282 | Tragic 11.3% |
| Indonesians | 0.0 /100 | #283 | Tragic 11.3% |
| Yaqui | 0.0 /100 | #284 | Tragic 11.3% |
| Barbadians | 0.0 /100 | #285 | Tragic 11.3% |
| Senegalese | 0.0 /100 | #286 | Tragic 11.5% |
| Vietnamese | 0.0 /100 | #287 | Tragic 11.5% |
| Immigrants | Belize | 0.0 /100 | #288 | Tragic 11.5% |