Uruguayan vs Immigrants from West Indies Family Poverty
COMPARE
Uruguayan
Immigrants from West Indies
Family Poverty
Family Poverty Comparison
Uruguayans
Immigrants from West Indies
9.1%
FAMILY POVERTY
39.2/ 100
METRIC RATING
183rd/ 347
METRIC RANK
11.3%
FAMILY POVERTY
0.0/ 100
METRIC RATING
281st/ 347
METRIC RANK
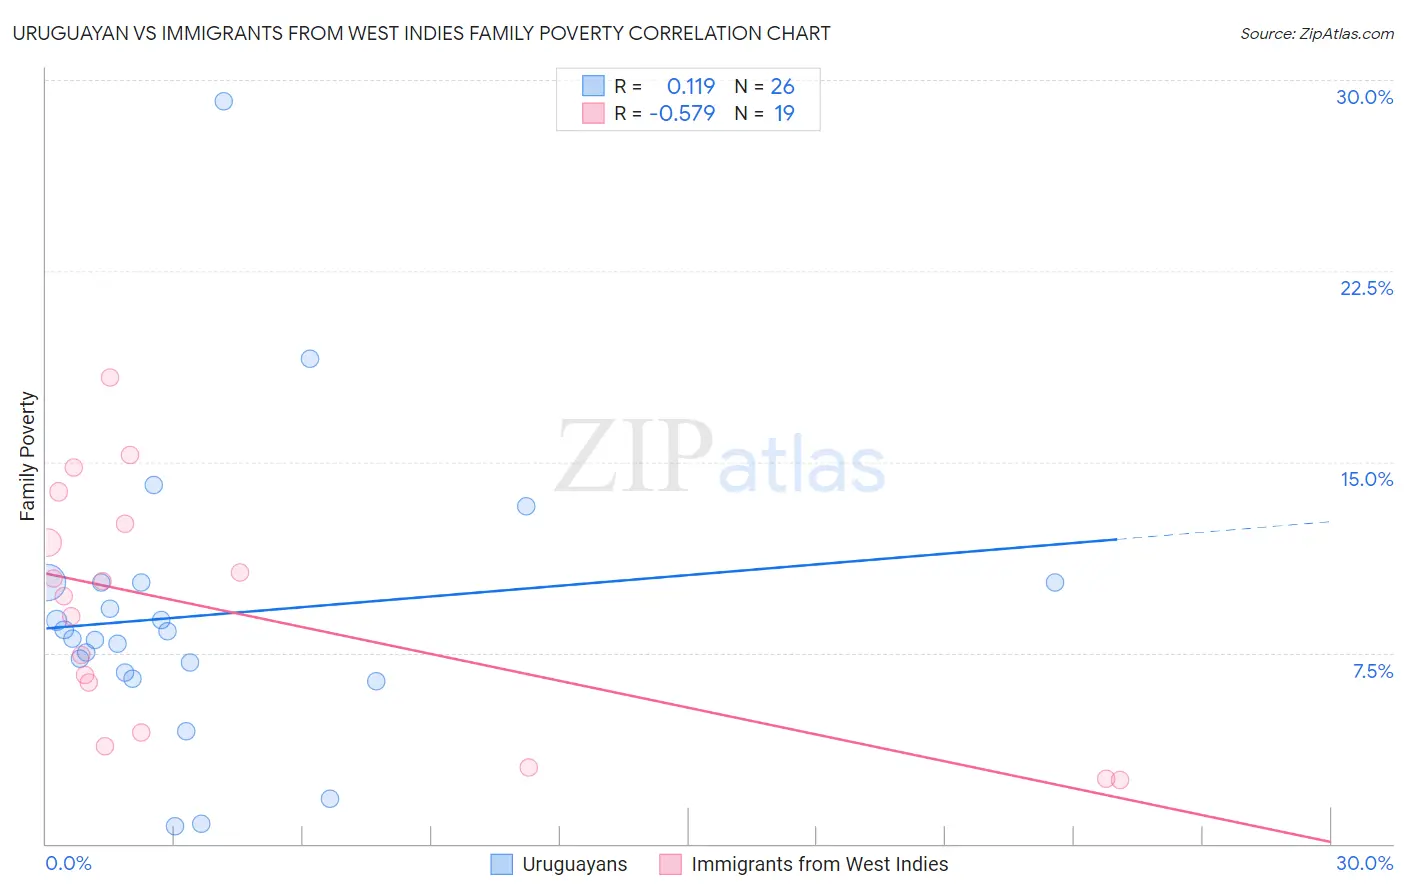
Uruguayan vs Immigrants from West Indies Family Poverty Correlation Chart
The statistical analysis conducted on geographies consisting of 144,644,922 people shows a poor positive correlation between the proportion of Uruguayans and poverty level among families in the United States with a correlation coefficient (R) of 0.119 and weighted average of 9.1%. Similarly, the statistical analysis conducted on geographies consisting of 72,448,648 people shows a substantial negative correlation between the proportion of Immigrants from West Indies and poverty level among families in the United States with a correlation coefficient (R) of -0.579 and weighted average of 11.3%, a difference of 23.6%.
Family Poverty Correlation Summary
| Measurement | Uruguayan | Immigrants from West Indies |
| Minimum | 0.67% | 2.5% |
| Maximum | 29.2% | 18.3% |
| Range | 28.5% | 15.8% |
| Mean | 9.0% | 9.1% |
| Median | 8.2% | 9.7% |
| Interquartile 25% (IQ1) | 6.7% | 4.4% |
| Interquartile 75% (IQ3) | 10.2% | 12.6% |
| Interquartile Range (IQR) | 3.5% | 8.2% |
| Standard Deviation (Sample) | 5.7% | 4.7% |
| Standard Deviation (Population) | 5.5% | 4.5% |
Similar Demographics by Family Poverty
Demographics Similar to Uruguayans by Family Poverty
In terms of family poverty, the demographic groups most similar to Uruguayans are South American Indian (9.1%, a difference of 0.070%), Immigrants from Saudi Arabia (9.1%, a difference of 0.080%), Immigrants from Morocco (9.1%, a difference of 0.13%), Hmong (9.1%, a difference of 0.14%), and Colombian (9.2%, a difference of 0.43%).
| Demographics | Rating | Rank | Family Poverty |
| Immigrants | Syria | 47.5 /100 | #176 | Average 9.0% |
| Hawaiians | 47.2 /100 | #177 | Average 9.0% |
| Immigrants | Cameroon | 47.1 /100 | #178 | Average 9.0% |
| Immigrants | Iraq | 44.4 /100 | #179 | Average 9.1% |
| Immigrants | Uganda | 43.4 /100 | #180 | Average 9.1% |
| Hmong | 40.2 /100 | #181 | Average 9.1% |
| Immigrants | Morocco | 40.2 /100 | #182 | Average 9.1% |
| Uruguayans | 39.2 /100 | #183 | Fair 9.1% |
| South American Indians | 38.7 /100 | #184 | Fair 9.1% |
| Immigrants | Saudi Arabia | 38.6 /100 | #185 | Fair 9.1% |
| Colombians | 36.1 /100 | #186 | Fair 9.2% |
| Delaware | 35.4 /100 | #187 | Fair 9.2% |
| Immigrants | Kenya | 34.0 /100 | #188 | Fair 9.2% |
| Immigrants | Afghanistan | 32.1 /100 | #189 | Fair 9.2% |
| Arabs | 31.5 /100 | #190 | Fair 9.2% |
Demographics Similar to Immigrants from West Indies by Family Poverty
In terms of family poverty, the demographic groups most similar to Immigrants from West Indies are Immigrants from Cuba (11.3%, a difference of 0.26%), Belizean (11.3%, a difference of 0.27%), Indonesian (11.3%, a difference of 0.30%), Blackfeet (11.3%, a difference of 0.31%), and Yaqui (11.3%, a difference of 0.42%).
| Demographics | Rating | Rank | Family Poverty |
| Spanish Americans | 0.1 /100 | #274 | Tragic 11.2% |
| Central Americans | 0.1 /100 | #275 | Tragic 11.2% |
| Immigrants | Guyana | 0.1 /100 | #276 | Tragic 11.2% |
| Chippewa | 0.1 /100 | #277 | Tragic 11.2% |
| Guyanese | 0.1 /100 | #278 | Tragic 11.2% |
| Blackfeet | 0.0 /100 | #279 | Tragic 11.3% |
| Belizeans | 0.0 /100 | #280 | Tragic 11.3% |
| Immigrants | West Indies | 0.0 /100 | #281 | Tragic 11.3% |
| Immigrants | Cuba | 0.0 /100 | #282 | Tragic 11.3% |
| Indonesians | 0.0 /100 | #283 | Tragic 11.3% |
| Yaqui | 0.0 /100 | #284 | Tragic 11.3% |
| Barbadians | 0.0 /100 | #285 | Tragic 11.3% |
| Senegalese | 0.0 /100 | #286 | Tragic 11.5% |
| Vietnamese | 0.0 /100 | #287 | Tragic 11.5% |
| Immigrants | Belize | 0.0 /100 | #288 | Tragic 11.5% |