Immigrants from South Central Asia vs Immigrants from West Indies Family Poverty
COMPARE
Immigrants from South Central Asia
Immigrants from West Indies
Family Poverty
Family Poverty Comparison
Immigrants from South Central Asia
Immigrants from West Indies
7.2%
FAMILY POVERTY
99.8/ 100
METRIC RATING
16th/ 347
METRIC RANK
11.3%
FAMILY POVERTY
0.0/ 100
METRIC RATING
281st/ 347
METRIC RANK
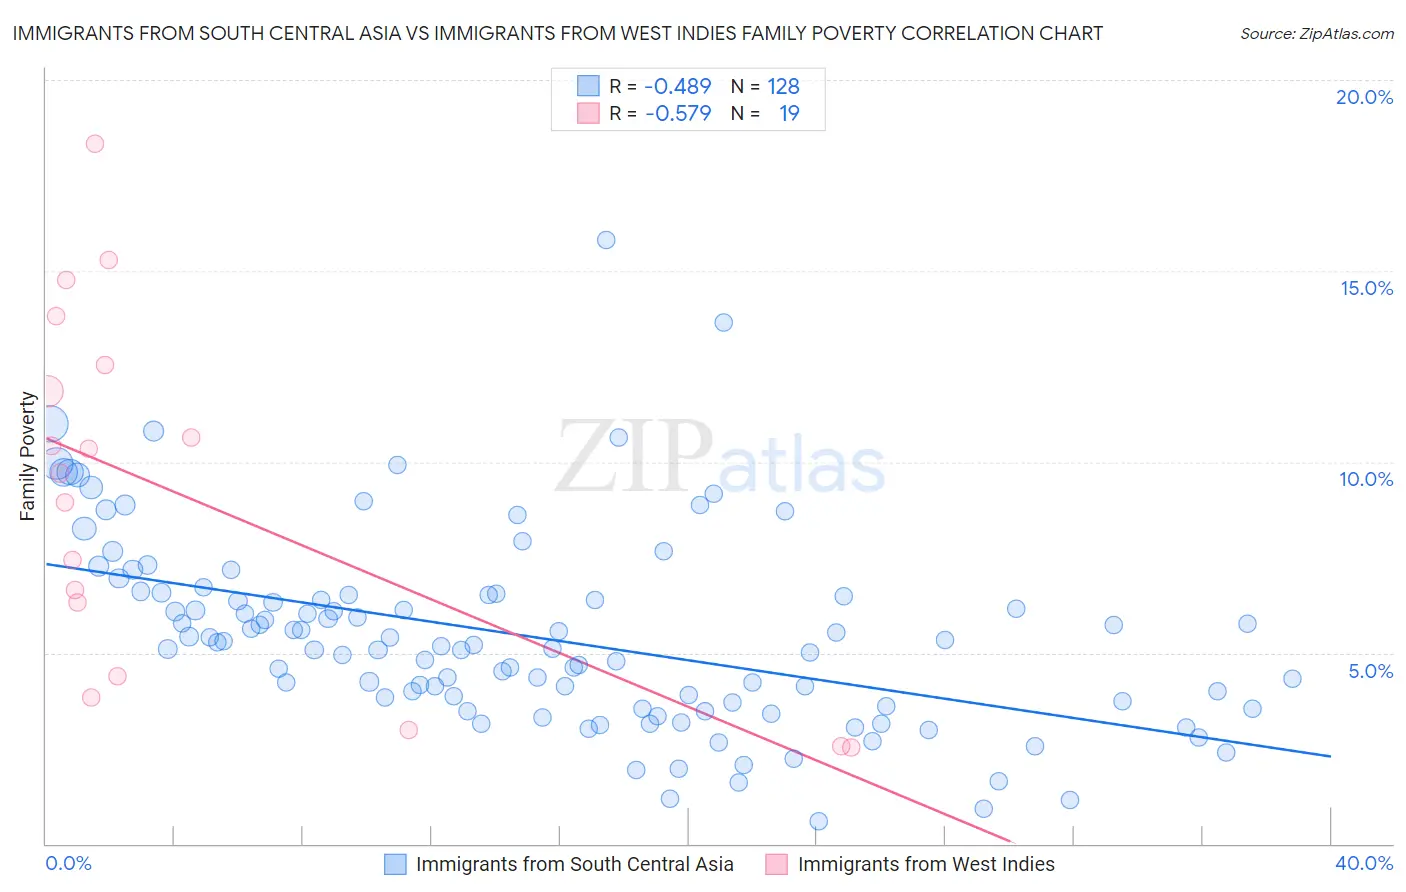
Immigrants from South Central Asia vs Immigrants from West Indies Family Poverty Correlation Chart
The statistical analysis conducted on geographies consisting of 471,025,257 people shows a moderate negative correlation between the proportion of Immigrants from South Central Asia and poverty level among families in the United States with a correlation coefficient (R) of -0.489 and weighted average of 7.2%. Similarly, the statistical analysis conducted on geographies consisting of 72,448,648 people shows a substantial negative correlation between the proportion of Immigrants from West Indies and poverty level among families in the United States with a correlation coefficient (R) of -0.579 and weighted average of 11.3%, a difference of 56.7%.
Family Poverty Correlation Summary
| Measurement | Immigrants from South Central Asia | Immigrants from West Indies |
| Minimum | 0.60% | 2.5% |
| Maximum | 15.8% | 18.3% |
| Range | 15.2% | 15.8% |
| Mean | 5.4% | 9.1% |
| Median | 5.2% | 9.7% |
| Interquartile 25% (IQ1) | 3.7% | 4.4% |
| Interquartile 75% (IQ3) | 6.5% | 12.6% |
| Interquartile Range (IQR) | 2.9% | 8.2% |
| Standard Deviation (Sample) | 2.5% | 4.7% |
| Standard Deviation (Population) | 2.5% | 4.5% |
Similar Demographics by Family Poverty
Demographics Similar to Immigrants from South Central Asia by Family Poverty
In terms of family poverty, the demographic groups most similar to Immigrants from South Central Asia are Luxembourger (7.2%, a difference of 0.22%), Immigrants from Lithuania (7.2%, a difference of 0.24%), Lithuanian (7.2%, a difference of 0.27%), Eastern European (7.2%, a difference of 0.54%), and Immigrants from Hong Kong (7.3%, a difference of 0.70%).
| Demographics | Rating | Rank | Family Poverty |
| Latvians | 99.9 /100 | #9 | Exceptional 7.1% |
| Bulgarians | 99.8 /100 | #10 | Exceptional 7.1% |
| Immigrants | Singapore | 99.8 /100 | #11 | Exceptional 7.1% |
| Maltese | 99.8 /100 | #12 | Exceptional 7.1% |
| Swedes | 99.8 /100 | #13 | Exceptional 7.1% |
| Iranians | 99.8 /100 | #14 | Exceptional 7.1% |
| Lithuanians | 99.8 /100 | #15 | Exceptional 7.2% |
| Immigrants | South Central Asia | 99.8 /100 | #16 | Exceptional 7.2% |
| Luxembourgers | 99.8 /100 | #17 | Exceptional 7.2% |
| Immigrants | Lithuania | 99.8 /100 | #18 | Exceptional 7.2% |
| Eastern Europeans | 99.7 /100 | #19 | Exceptional 7.2% |
| Immigrants | Hong Kong | 99.7 /100 | #20 | Exceptional 7.3% |
| Immigrants | Iran | 99.7 /100 | #21 | Exceptional 7.3% |
| Danes | 99.7 /100 | #22 | Exceptional 7.3% |
| Assyrians/Chaldeans/Syriacs | 99.7 /100 | #23 | Exceptional 7.3% |
Demographics Similar to Immigrants from West Indies by Family Poverty
In terms of family poverty, the demographic groups most similar to Immigrants from West Indies are Immigrants from Cuba (11.3%, a difference of 0.26%), Belizean (11.3%, a difference of 0.27%), Indonesian (11.3%, a difference of 0.30%), Blackfeet (11.3%, a difference of 0.31%), and Yaqui (11.3%, a difference of 0.42%).
| Demographics | Rating | Rank | Family Poverty |
| Spanish Americans | 0.1 /100 | #274 | Tragic 11.2% |
| Central Americans | 0.1 /100 | #275 | Tragic 11.2% |
| Immigrants | Guyana | 0.1 /100 | #276 | Tragic 11.2% |
| Chippewa | 0.1 /100 | #277 | Tragic 11.2% |
| Guyanese | 0.1 /100 | #278 | Tragic 11.2% |
| Blackfeet | 0.0 /100 | #279 | Tragic 11.3% |
| Belizeans | 0.0 /100 | #280 | Tragic 11.3% |
| Immigrants | West Indies | 0.0 /100 | #281 | Tragic 11.3% |
| Immigrants | Cuba | 0.0 /100 | #282 | Tragic 11.3% |
| Indonesians | 0.0 /100 | #283 | Tragic 11.3% |
| Yaqui | 0.0 /100 | #284 | Tragic 11.3% |
| Barbadians | 0.0 /100 | #285 | Tragic 11.3% |
| Senegalese | 0.0 /100 | #286 | Tragic 11.5% |
| Vietnamese | 0.0 /100 | #287 | Tragic 11.5% |
| Immigrants | Belize | 0.0 /100 | #288 | Tragic 11.5% |