Cuban vs Immigrants from West Indies 6th Grade
COMPARE
Cuban
Immigrants from West Indies
6th Grade
6th Grade Comparison
Cubans
Immigrants from West Indies
96.2%
6TH GRADE
0.1/ 100
METRIC RATING
283rd/ 347
METRIC RANK
96.1%
6TH GRADE
0.0/ 100
METRIC RATING
293rd/ 347
METRIC RANK
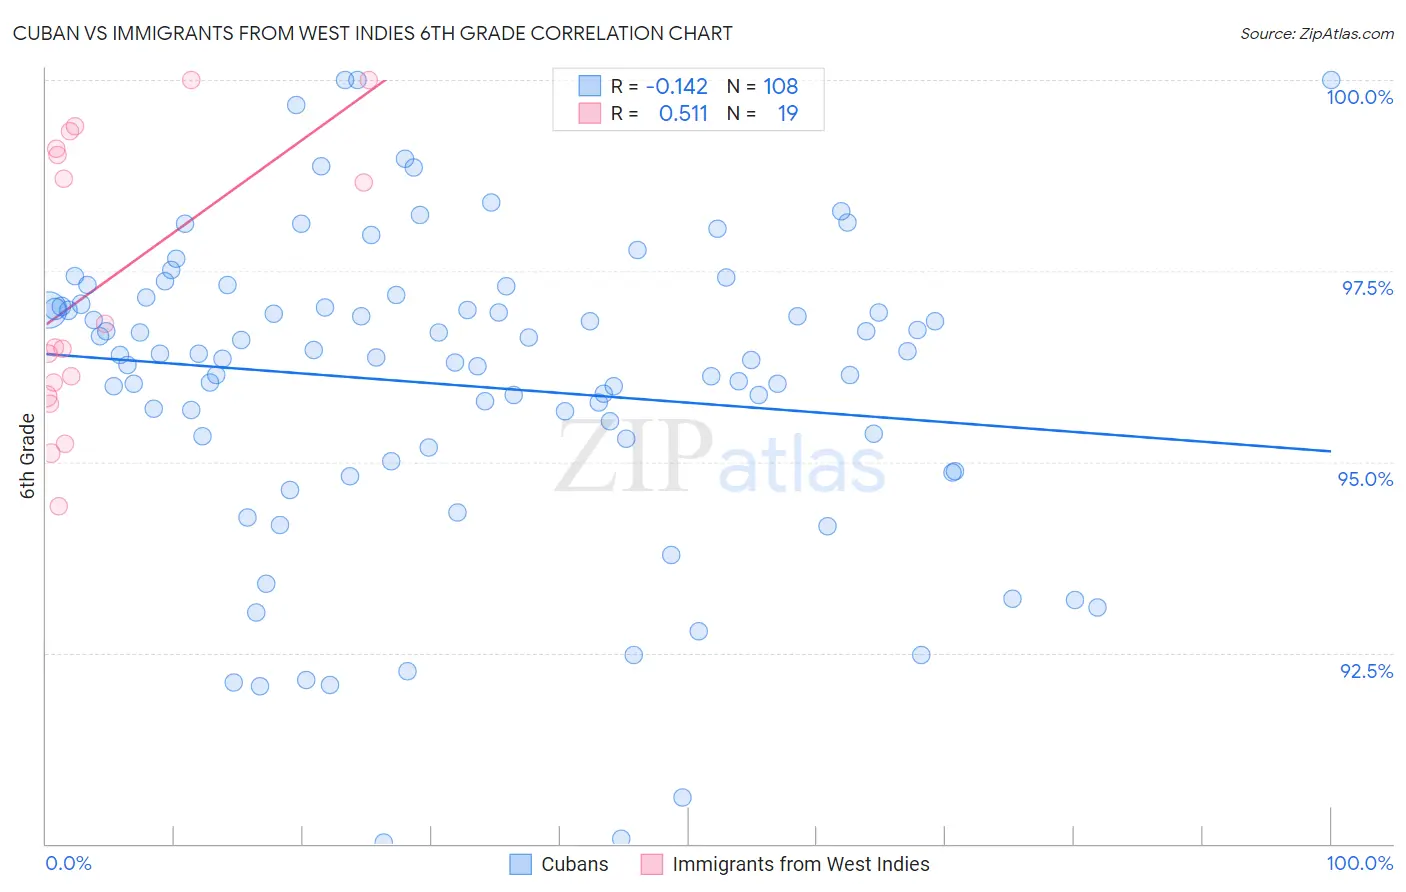
Cuban vs Immigrants from West Indies 6th Grade Correlation Chart
The statistical analysis conducted on geographies consisting of 449,326,865 people shows a poor negative correlation between the proportion of Cubans and percentage of population with at least 6th grade education in the United States with a correlation coefficient (R) of -0.142 and weighted average of 96.2%. Similarly, the statistical analysis conducted on geographies consisting of 72,457,514 people shows a substantial positive correlation between the proportion of Immigrants from West Indies and percentage of population with at least 6th grade education in the United States with a correlation coefficient (R) of 0.511 and weighted average of 96.1%, a difference of 0.17%.
6th Grade Correlation Summary
| Measurement | Cuban | Immigrants from West Indies |
| Minimum | 90.0% | 94.4% |
| Maximum | 100.0% | 100.0% |
| Range | 10.0% | 5.6% |
| Mean | 96.0% | 97.3% |
| Median | 96.4% | 96.5% |
| Interquartile 25% (IQ1) | 95.2% | 95.9% |
| Interquartile 75% (IQ3) | 97.0% | 99.1% |
| Interquartile Range (IQR) | 1.8% | 3.2% |
| Standard Deviation (Sample) | 2.0% | 1.8% |
| Standard Deviation (Population) | 2.0% | 1.8% |
Demographics Similar to Cubans and Immigrants from West Indies by 6th Grade
In terms of 6th grade, the demographic groups most similar to Cubans are Trinidadian and Tobagonian (96.2%, a difference of 0.010%), Houma (96.2%, a difference of 0.010%), Fijian (96.2%, a difference of 0.010%), Immigrants from Peru (96.2%, a difference of 0.020%), and Immigrants from Afghanistan (96.2%, a difference of 0.020%). Similarly, the demographic groups most similar to Immigrants from West Indies are Immigrants from Barbados (96.1%, a difference of 0.040%), Immigrants from Somalia (96.1%, a difference of 0.060%), Immigrants from St. Vincent and the Grenadines (96.1%, a difference of 0.060%), British West Indian (96.0%, a difference of 0.070%), and Immigrants from Eritrea (96.1%, a difference of 0.080%).
| Demographics | Rating | Rank | 6th Grade |
| Immigrants | Thailand | 0.1 /100 | #278 | Tragic 96.3% |
| Immigrants | Peru | 0.1 /100 | #279 | Tragic 96.2% |
| Immigrants | Afghanistan | 0.1 /100 | #280 | Tragic 96.2% |
| Trinidadians and Tobagonians | 0.1 /100 | #281 | Tragic 96.2% |
| Houma | 0.1 /100 | #282 | Tragic 96.2% |
| Cubans | 0.1 /100 | #283 | Tragic 96.2% |
| Fijians | 0.1 /100 | #284 | Tragic 96.2% |
| Somalis | 0.1 /100 | #285 | Tragic 96.2% |
| Barbadians | 0.0 /100 | #286 | Tragic 96.2% |
| Immigrants | Trinidad and Tobago | 0.0 /100 | #287 | Tragic 96.2% |
| Malaysians | 0.0 /100 | #288 | Tragic 96.2% |
| Immigrants | Eritrea | 0.0 /100 | #289 | Tragic 96.1% |
| Immigrants | Somalia | 0.0 /100 | #290 | Tragic 96.1% |
| Immigrants | St. Vincent and the Grenadines | 0.0 /100 | #291 | Tragic 96.1% |
| Immigrants | Barbados | 0.0 /100 | #292 | Tragic 96.1% |
| Immigrants | West Indies | 0.0 /100 | #293 | Tragic 96.1% |
| British West Indians | 0.0 /100 | #294 | Tragic 96.0% |
| Immigrants | Grenada | 0.0 /100 | #295 | Tragic 95.9% |
| Immigrants | South Eastern Asia | 0.0 /100 | #296 | Tragic 95.9% |
| Haitians | 0.0 /100 | #297 | Tragic 95.8% |
| Sri Lankans | 0.0 /100 | #298 | Tragic 95.8% |