Cuban vs Immigrants from West Indies Median Family Income
COMPARE
Cuban
Immigrants from West Indies
Median Family Income
Median Family Income Comparison
Cubans
Immigrants from West Indies
$84,981
MEDIAN FAMILY INCOME
0.0/ 100
METRIC RATING
312th/ 347
METRIC RANK
$91,588
MEDIAN FAMILY INCOME
0.3/ 100
METRIC RATING
263rd/ 347
METRIC RANK
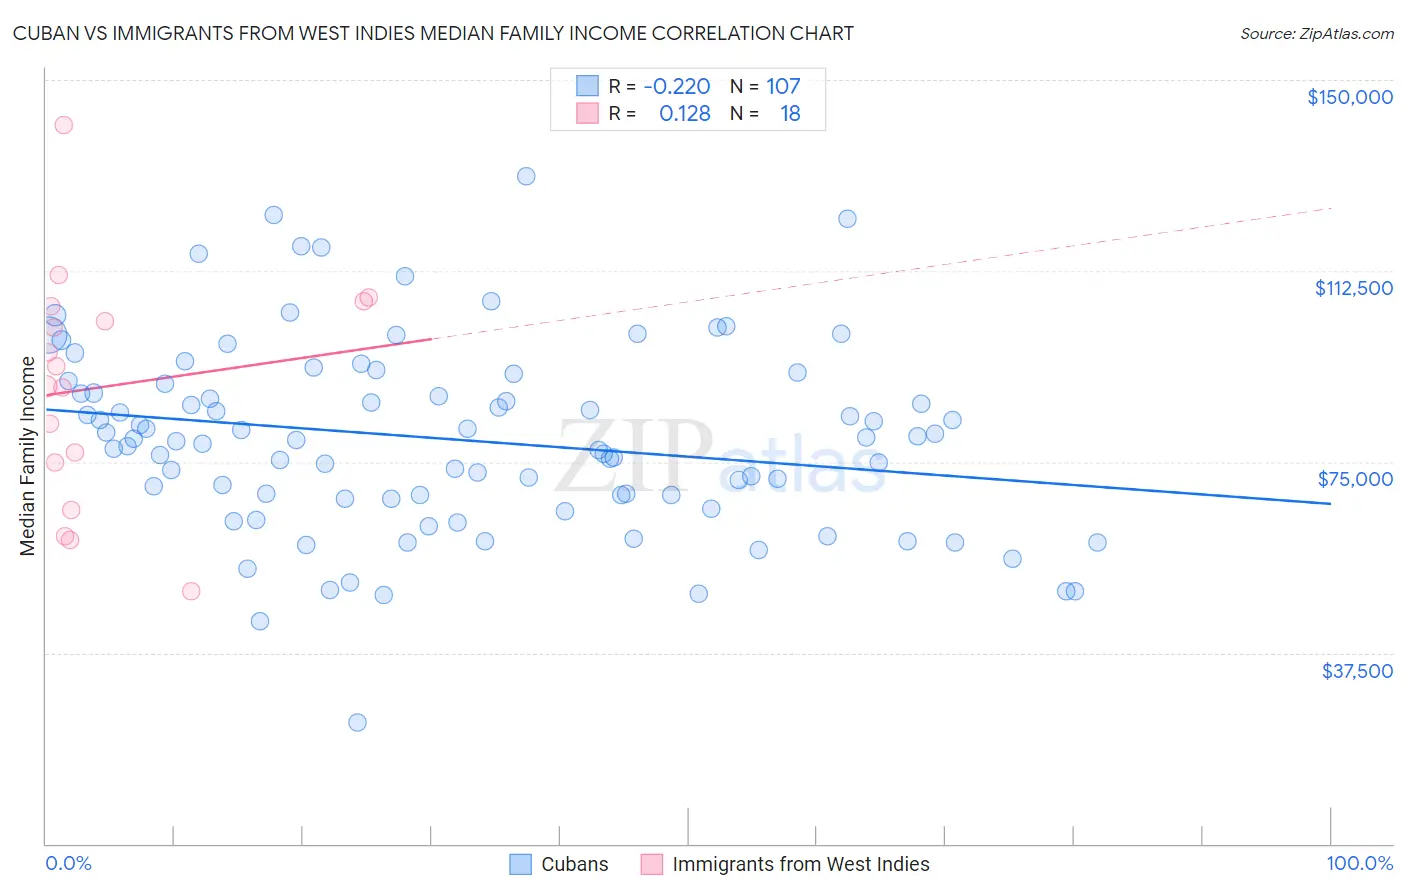
Cuban vs Immigrants from West Indies Median Family Income Correlation Chart
The statistical analysis conducted on geographies consisting of 448,691,327 people shows a weak negative correlation between the proportion of Cubans and median family income in the United States with a correlation coefficient (R) of -0.220 and weighted average of $84,981. Similarly, the statistical analysis conducted on geographies consisting of 72,412,445 people shows a poor positive correlation between the proportion of Immigrants from West Indies and median family income in the United States with a correlation coefficient (R) of 0.128 and weighted average of $91,588, a difference of 7.8%.
Median Family Income Correlation Summary
| Measurement | Cuban | Immigrants from West Indies |
| Minimum | $23,750 | $49,539 |
| Maximum | $131,198 | $141,054 |
| Range | $107,448 | $91,515 |
| Mean | $79,388 | $89,730 |
| Median | $79,353 | $91,813 |
| Interquartile 25% (IQ1) | $67,815 | $74,771 |
| Interquartile 75% (IQ3) | $90,371 | $105,524 |
| Interquartile Range (IQR) | $22,555 | $30,753 |
| Standard Deviation (Sample) | $18,688 | $22,647 |
| Standard Deviation (Population) | $18,601 | $22,009 |
Similar Demographics by Median Family Income
Demographics Similar to Cubans by Median Family Income
In terms of median family income, the demographic groups most similar to Cubans are Honduran ($85,004, a difference of 0.030%), Immigrants from Central America ($85,050, a difference of 0.080%), Choctaw ($84,835, a difference of 0.17%), Haitian ($85,218, a difference of 0.28%), and Immigrants from Bahamas ($84,732, a difference of 0.29%).
| Demographics | Rating | Rank | Median Family Income |
| Paiute | 0.0 /100 | #305 | Tragic $85,414 |
| Immigrants | Dominica | 0.0 /100 | #306 | Tragic $85,411 |
| Chickasaw | 0.0 /100 | #307 | Tragic $85,356 |
| U.S. Virgin Islanders | 0.0 /100 | #308 | Tragic $85,294 |
| Haitians | 0.0 /100 | #309 | Tragic $85,218 |
| Immigrants | Central America | 0.0 /100 | #310 | Tragic $85,050 |
| Hondurans | 0.0 /100 | #311 | Tragic $85,004 |
| Cubans | 0.0 /100 | #312 | Tragic $84,981 |
| Choctaw | 0.0 /100 | #313 | Tragic $84,835 |
| Immigrants | Bahamas | 0.0 /100 | #314 | Tragic $84,732 |
| Apache | 0.0 /100 | #315 | Tragic $84,451 |
| Immigrants | Haiti | 0.0 /100 | #316 | Tragic $84,018 |
| Yakama | 0.0 /100 | #317 | Tragic $83,932 |
| Immigrants | Mexico | 0.0 /100 | #318 | Tragic $83,639 |
| Immigrants | Honduras | 0.0 /100 | #319 | Tragic $83,618 |
Demographics Similar to Immigrants from West Indies by Median Family Income
In terms of median family income, the demographic groups most similar to Immigrants from West Indies are Senegalese ($91,475, a difference of 0.12%), Liberian ($91,722, a difference of 0.15%), Inupiat ($91,730, a difference of 0.16%), Pennsylvania German ($91,763, a difference of 0.19%), and Cape Verdean ($91,848, a difference of 0.28%).
| Demographics | Rating | Rank | Median Family Income |
| Nicaraguans | 0.5 /100 | #256 | Tragic $92,231 |
| Americans | 0.4 /100 | #257 | Tragic $92,096 |
| Osage | 0.4 /100 | #258 | Tragic $91,926 |
| Cape Verdeans | 0.4 /100 | #259 | Tragic $91,848 |
| Pennsylvania Germans | 0.4 /100 | #260 | Tragic $91,763 |
| Inupiat | 0.4 /100 | #261 | Tragic $91,730 |
| Liberians | 0.4 /100 | #262 | Tragic $91,722 |
| Immigrants | West Indies | 0.3 /100 | #263 | Tragic $91,588 |
| Senegalese | 0.3 /100 | #264 | Tragic $91,475 |
| Hmong | 0.3 /100 | #265 | Tragic $91,296 |
| Central Americans | 0.3 /100 | #266 | Tragic $91,087 |
| Mexican American Indians | 0.2 /100 | #267 | Tragic $90,918 |
| Cree | 0.2 /100 | #268 | Tragic $90,882 |
| Belizeans | 0.2 /100 | #269 | Tragic $90,880 |
| Jamaicans | 0.2 /100 | #270 | Tragic $90,581 |