Cuban vs Chilean Family Poverty
COMPARE
Cuban
Chilean
Family Poverty
Family Poverty Comparison
Cubans
Chileans
10.6%
FAMILY POVERTY
0.4/ 100
METRIC RATING
249th/ 347
METRIC RANK
8.5%
FAMILY POVERTY
86.6/ 100
METRIC RATING
134th/ 347
METRIC RANK
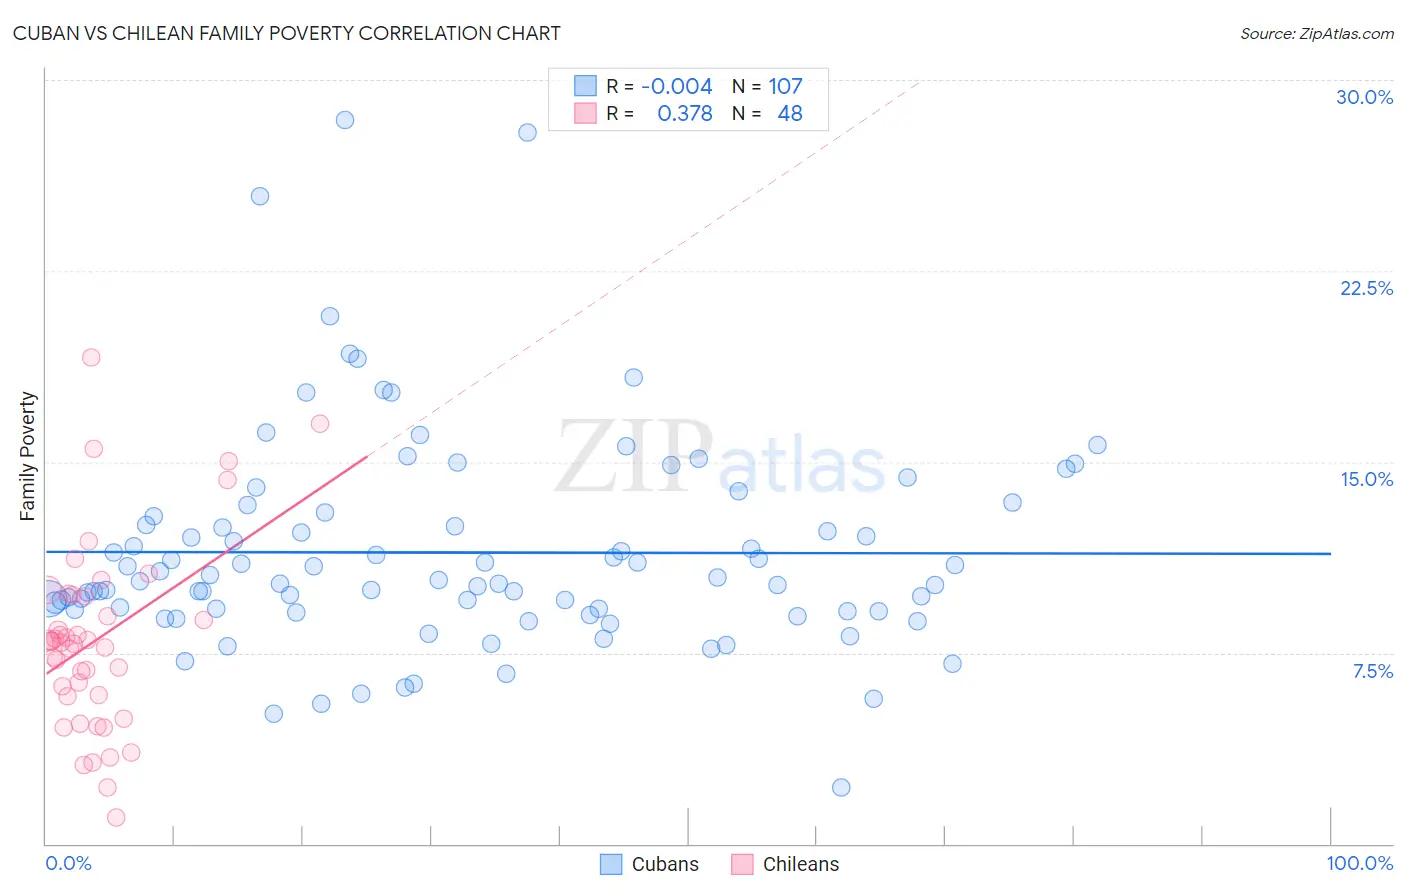
Cuban vs Chilean Family Poverty Correlation Chart
The statistical analysis conducted on geographies consisting of 447,916,186 people shows no correlation between the proportion of Cubans and poverty level among families in the United States with a correlation coefficient (R) of -0.004 and weighted average of 10.6%. Similarly, the statistical analysis conducted on geographies consisting of 256,264,406 people shows a mild positive correlation between the proportion of Chileans and poverty level among families in the United States with a correlation coefficient (R) of 0.378 and weighted average of 8.5%, a difference of 25.7%.
Family Poverty Correlation Summary
| Measurement | Cuban | Chilean |
| Minimum | 2.2% | 1.0% |
| Maximum | 28.4% | 19.1% |
| Range | 26.2% | 18.1% |
| Mean | 11.4% | 8.0% |
| Median | 10.3% | 7.9% |
| Interquartile 25% (IQ1) | 9.1% | 5.8% |
| Interquartile 75% (IQ3) | 12.9% | 9.7% |
| Interquartile Range (IQR) | 3.8% | 3.9% |
| Standard Deviation (Sample) | 4.2% | 3.7% |
| Standard Deviation (Population) | 4.2% | 3.6% |
Similar Demographics by Family Poverty
Demographics Similar to Cubans by Family Poverty
In terms of family poverty, the demographic groups most similar to Cubans are Nicaraguan (10.6%, a difference of 0.050%), Liberian (10.6%, a difference of 0.25%), Cherokee (10.6%, a difference of 0.34%), Salvadoran (10.7%, a difference of 0.53%), and Iroquois (10.7%, a difference of 0.81%).
| Demographics | Rating | Rank | Family Poverty |
| Alaska Natives | 1.0 /100 | #242 | Tragic 10.4% |
| Nepalese | 0.8 /100 | #243 | Tragic 10.4% |
| Cree | 0.7 /100 | #244 | Tragic 10.5% |
| Immigrants | Burma/Myanmar | 0.6 /100 | #245 | Tragic 10.5% |
| Cherokee | 0.5 /100 | #246 | Tragic 10.6% |
| Liberians | 0.4 /100 | #247 | Tragic 10.6% |
| Nicaraguans | 0.4 /100 | #248 | Tragic 10.6% |
| Cubans | 0.4 /100 | #249 | Tragic 10.6% |
| Salvadorans | 0.3 /100 | #250 | Tragic 10.7% |
| Iroquois | 0.3 /100 | #251 | Tragic 10.7% |
| Immigrants | Zaire | 0.3 /100 | #252 | Tragic 10.7% |
| Immigrants | Western Africa | 0.3 /100 | #253 | Tragic 10.7% |
| Ecuadorians | 0.2 /100 | #254 | Tragic 10.8% |
| Immigrants | Liberia | 0.2 /100 | #255 | Tragic 10.8% |
| Chickasaw | 0.2 /100 | #256 | Tragic 10.8% |
Demographics Similar to Chileans by Family Poverty
In terms of family poverty, the demographic groups most similar to Chileans are Sri Lankan (8.5%, a difference of 0.010%), Immigrants from Malaysia (8.5%, a difference of 0.040%), Immigrants from Brazil (8.5%, a difference of 0.080%), Immigrants from Southern Europe (8.5%, a difference of 0.16%), and Immigrants from Argentina (8.4%, a difference of 0.51%).
| Demographics | Rating | Rank | Family Poverty |
| Immigrants | Hungary | 89.9 /100 | #127 | Excellent 8.4% |
| Argentineans | 89.6 /100 | #128 | Excellent 8.4% |
| Portuguese | 89.2 /100 | #129 | Excellent 8.4% |
| Immigrants | Bosnia and Herzegovina | 88.6 /100 | #130 | Excellent 8.4% |
| Puget Sound Salish | 88.6 /100 | #131 | Excellent 8.4% |
| Immigrants | Argentina | 88.2 /100 | #132 | Excellent 8.4% |
| Sri Lankans | 86.6 /100 | #133 | Excellent 8.5% |
| Chileans | 86.6 /100 | #134 | Excellent 8.5% |
| Immigrants | Malaysia | 86.5 /100 | #135 | Excellent 8.5% |
| Immigrants | Brazil | 86.3 /100 | #136 | Excellent 8.5% |
| Immigrants | Southern Europe | 86.0 /100 | #137 | Excellent 8.5% |
| Armenians | 84.6 /100 | #138 | Excellent 8.5% |
| Immigrants | Nepal | 84.2 /100 | #139 | Excellent 8.5% |
| Immigrants | Kazakhstan | 84.1 /100 | #140 | Excellent 8.5% |
| Immigrants | Ukraine | 83.9 /100 | #141 | Excellent 8.5% |