Austrian vs Immigrants from West Indies Family Poverty
COMPARE
Austrian
Immigrants from West Indies
Family Poverty
Family Poverty Comparison
Austrians
Immigrants from West Indies
7.8%
FAMILY POVERTY
98.2/ 100
METRIC RATING
73rd/ 347
METRIC RANK
11.3%
FAMILY POVERTY
0.0/ 100
METRIC RATING
281st/ 347
METRIC RANK
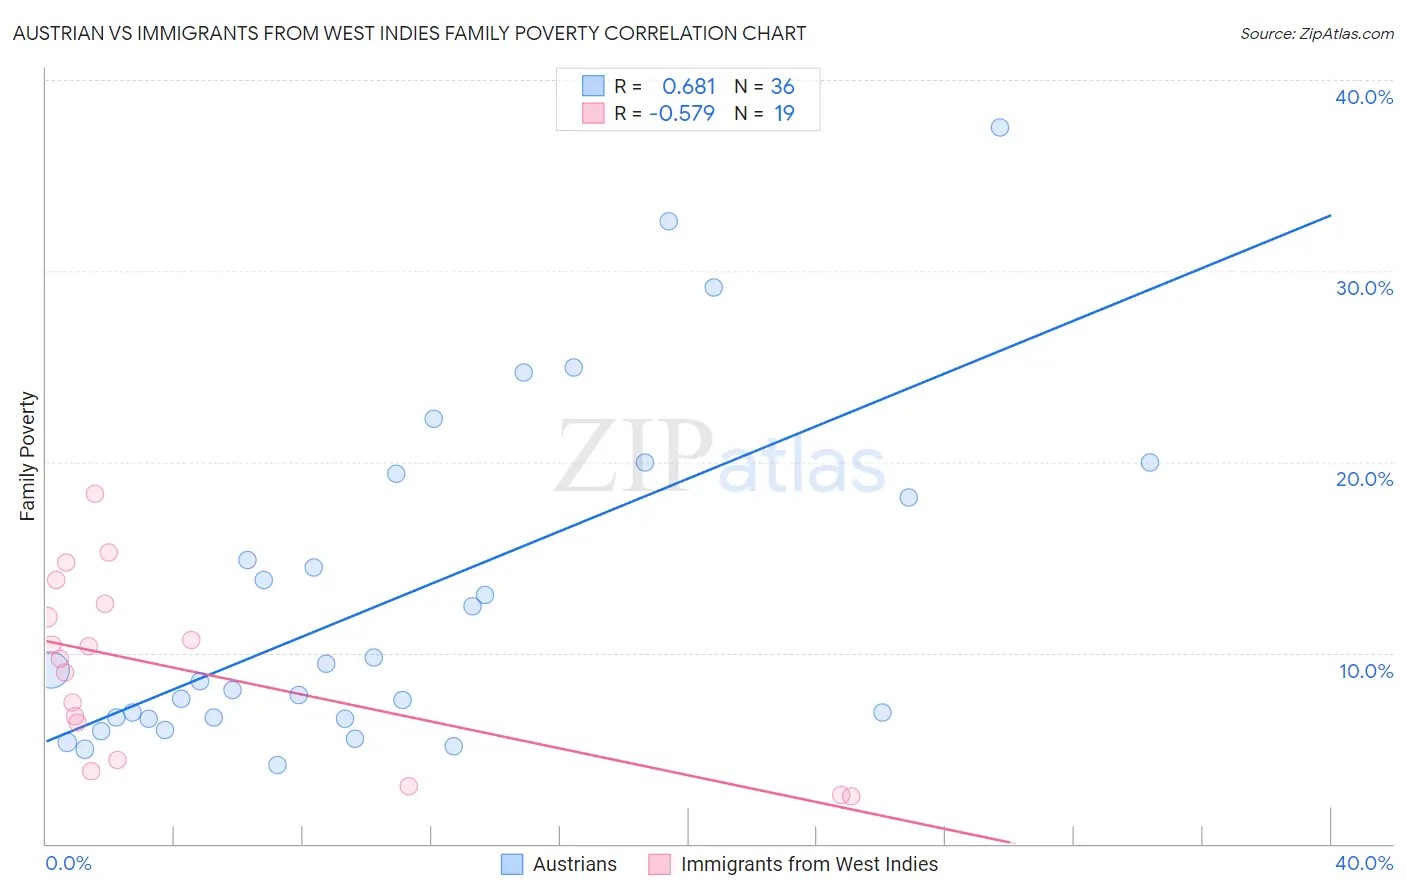
Austrian vs Immigrants from West Indies Family Poverty Correlation Chart
The statistical analysis conducted on geographies consisting of 450,050,339 people shows a significant positive correlation between the proportion of Austrians and poverty level among families in the United States with a correlation coefficient (R) of 0.681 and weighted average of 7.8%. Similarly, the statistical analysis conducted on geographies consisting of 72,448,648 people shows a substantial negative correlation between the proportion of Immigrants from West Indies and poverty level among families in the United States with a correlation coefficient (R) of -0.579 and weighted average of 11.3%, a difference of 44.2%.
Family Poverty Correlation Summary
| Measurement | Austrian | Immigrants from West Indies |
| Minimum | 4.1% | 2.5% |
| Maximum | 37.5% | 18.3% |
| Range | 33.4% | 15.8% |
| Mean | 12.8% | 9.1% |
| Median | 8.8% | 9.7% |
| Interquartile 25% (IQ1) | 6.6% | 4.4% |
| Interquartile 75% (IQ3) | 18.8% | 12.6% |
| Interquartile Range (IQR) | 12.2% | 8.2% |
| Standard Deviation (Sample) | 8.6% | 4.7% |
| Standard Deviation (Population) | 8.5% | 4.5% |
Similar Demographics by Family Poverty
Demographics Similar to Austrians by Family Poverty
In terms of family poverty, the demographic groups most similar to Austrians are Immigrants from Romania (7.8%, a difference of 0.0%), Cambodian (7.8%, a difference of 0.060%), Immigrants from China (7.8%, a difference of 0.070%), Immigrants from Canada (7.8%, a difference of 0.080%), and Immigrants from Belgium (7.8%, a difference of 0.13%).
| Demographics | Rating | Rank | Family Poverty |
| Dutch | 98.3 /100 | #66 | Exceptional 7.8% |
| Northern Europeans | 98.3 /100 | #67 | Exceptional 7.8% |
| Australians | 98.2 /100 | #68 | Exceptional 7.8% |
| Immigrants | Belgium | 98.2 /100 | #69 | Exceptional 7.8% |
| Immigrants | Canada | 98.2 /100 | #70 | Exceptional 7.8% |
| Cambodians | 98.2 /100 | #71 | Exceptional 7.8% |
| Immigrants | Romania | 98.2 /100 | #72 | Exceptional 7.8% |
| Austrians | 98.2 /100 | #73 | Exceptional 7.8% |
| Immigrants | China | 98.1 /100 | #74 | Exceptional 7.8% |
| Immigrants | Croatia | 98.1 /100 | #75 | Exceptional 7.8% |
| Immigrants | Latvia | 98.0 /100 | #76 | Exceptional 7.9% |
| Ukrainians | 98.0 /100 | #77 | Exceptional 7.9% |
| Immigrants | North America | 97.9 /100 | #78 | Exceptional 7.9% |
| Immigrants | Europe | 97.8 /100 | #79 | Exceptional 7.9% |
| English | 97.8 /100 | #80 | Exceptional 7.9% |
Demographics Similar to Immigrants from West Indies by Family Poverty
In terms of family poverty, the demographic groups most similar to Immigrants from West Indies are Immigrants from Cuba (11.3%, a difference of 0.26%), Belizean (11.3%, a difference of 0.27%), Indonesian (11.3%, a difference of 0.30%), Blackfeet (11.3%, a difference of 0.31%), and Yaqui (11.3%, a difference of 0.42%).
| Demographics | Rating | Rank | Family Poverty |
| Spanish Americans | 0.1 /100 | #274 | Tragic 11.2% |
| Central Americans | 0.1 /100 | #275 | Tragic 11.2% |
| Immigrants | Guyana | 0.1 /100 | #276 | Tragic 11.2% |
| Chippewa | 0.1 /100 | #277 | Tragic 11.2% |
| Guyanese | 0.1 /100 | #278 | Tragic 11.2% |
| Blackfeet | 0.0 /100 | #279 | Tragic 11.3% |
| Belizeans | 0.0 /100 | #280 | Tragic 11.3% |
| Immigrants | West Indies | 0.0 /100 | #281 | Tragic 11.3% |
| Immigrants | Cuba | 0.0 /100 | #282 | Tragic 11.3% |
| Indonesians | 0.0 /100 | #283 | Tragic 11.3% |
| Yaqui | 0.0 /100 | #284 | Tragic 11.3% |
| Barbadians | 0.0 /100 | #285 | Tragic 11.3% |
| Senegalese | 0.0 /100 | #286 | Tragic 11.5% |
| Vietnamese | 0.0 /100 | #287 | Tragic 11.5% |
| Immigrants | Belize | 0.0 /100 | #288 | Tragic 11.5% |