Cree vs Immigrants from West Indies Married-Couple Family Poverty
COMPARE
Cree
Immigrants from West Indies
Married-Couple Family Poverty
Married-Couple Family Poverty Comparison
Cree
Immigrants from West Indies
5.9%
MARRIED-COUPLE FAMILY POVERTY
1.2/ 100
METRIC RATING
248th/ 347
METRIC RANK
6.2%
MARRIED-COUPLE FAMILY POVERTY
0.1/ 100
METRIC RATING
269th/ 347
METRIC RANK
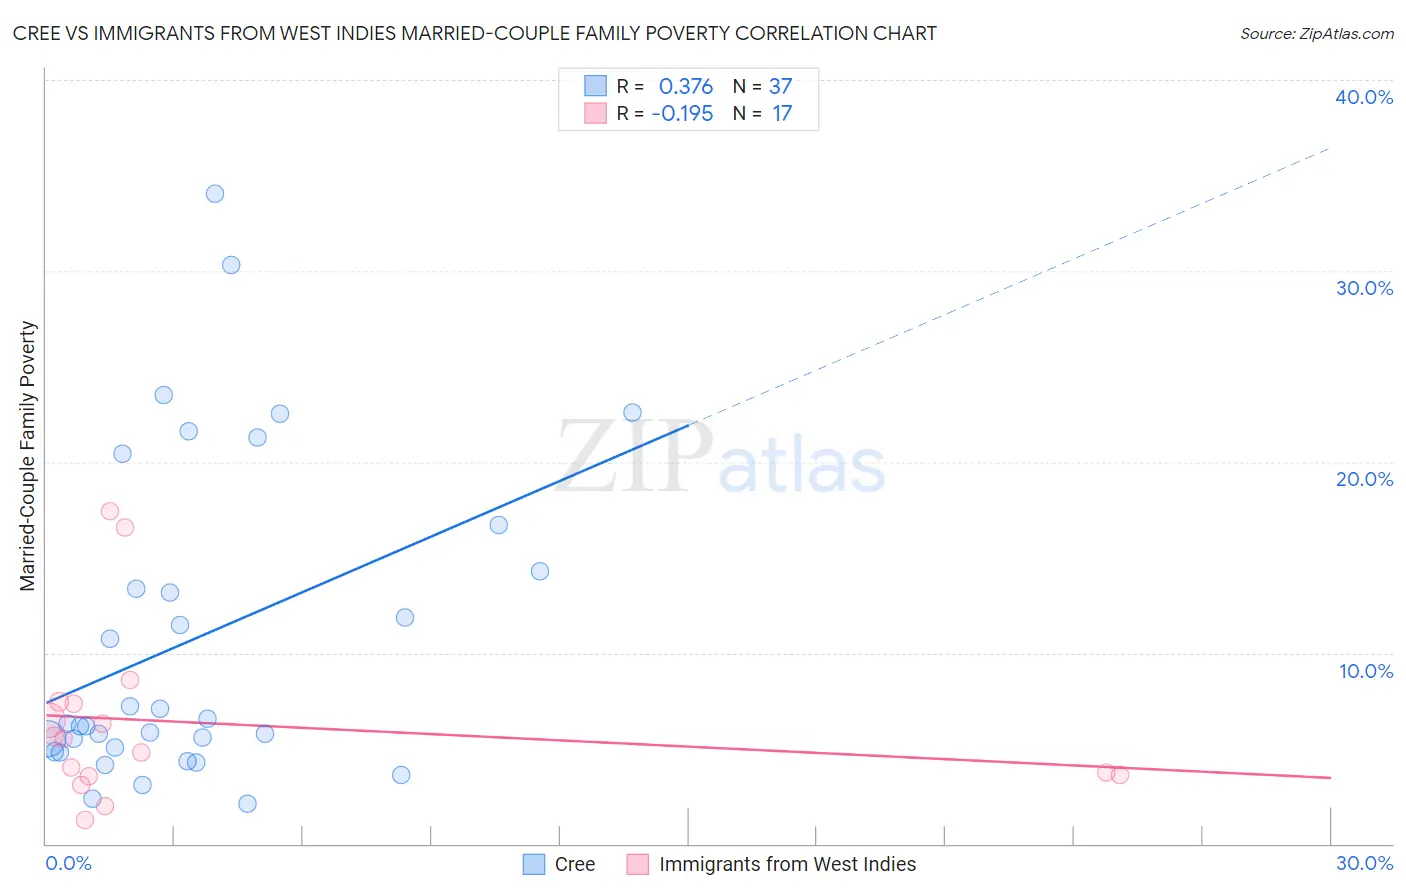
Cree vs Immigrants from West Indies Married-Couple Family Poverty Correlation Chart
The statistical analysis conducted on geographies consisting of 76,066,052 people shows a mild positive correlation between the proportion of Cree and poverty level among married-couple families in the United States with a correlation coefficient (R) of 0.376 and weighted average of 5.9%. Similarly, the statistical analysis conducted on geographies consisting of 72,419,228 people shows a poor negative correlation between the proportion of Immigrants from West Indies and poverty level among married-couple families in the United States with a correlation coefficient (R) of -0.195 and weighted average of 6.2%, a difference of 5.5%.
Married-Couple Family Poverty Correlation Summary
| Measurement | Cree | Immigrants from West Indies |
| Minimum | 2.1% | 1.2% |
| Maximum | 34.0% | 17.4% |
| Range | 31.9% | 16.2% |
| Mean | 10.8% | 6.3% |
| Median | 6.3% | 5.5% |
| Interquartile 25% (IQ1) | 4.9% | 3.6% |
| Interquartile 75% (IQ3) | 15.5% | 7.4% |
| Interquartile Range (IQR) | 10.5% | 3.8% |
| Standard Deviation (Sample) | 8.3% | 4.5% |
| Standard Deviation (Population) | 8.2% | 4.3% |
Similar Demographics by Married-Couple Family Poverty
Demographics Similar to Cree by Married-Couple Family Poverty
In terms of married-couple family poverty, the demographic groups most similar to Cree are Tsimshian (5.9%, a difference of 0.10%), Immigrants from Eritrea (5.9%, a difference of 0.31%), Iraqi (5.9%, a difference of 0.42%), Immigrants from Ghana (5.9%, a difference of 0.57%), and Immigrants from Venezuela (5.8%, a difference of 1.0%).
| Demographics | Rating | Rank | Married-Couple Family Poverty |
| Immigrants | Panama | 2.5 /100 | #241 | Tragic 5.8% |
| Immigrants | Western Africa | 2.4 /100 | #242 | Tragic 5.8% |
| Somalis | 2.3 /100 | #243 | Tragic 5.8% |
| Chickasaw | 2.3 /100 | #244 | Tragic 5.8% |
| Immigrants | Afghanistan | 2.1 /100 | #245 | Tragic 5.8% |
| Immigrants | Venezuela | 1.8 /100 | #246 | Tragic 5.8% |
| Iraqis | 1.4 /100 | #247 | Tragic 5.9% |
| Cree | 1.2 /100 | #248 | Tragic 5.9% |
| Tsimshian | 1.1 /100 | #249 | Tragic 5.9% |
| Immigrants | Eritrea | 1.1 /100 | #250 | Tragic 5.9% |
| Immigrants | Ghana | 1.0 /100 | #251 | Tragic 5.9% |
| Immigrants | Western Asia | 0.7 /100 | #252 | Tragic 6.0% |
| Africans | 0.7 /100 | #253 | Tragic 6.0% |
| Immigrants | Somalia | 0.7 /100 | #254 | Tragic 6.0% |
| Comanche | 0.7 /100 | #255 | Tragic 6.0% |
Demographics Similar to Immigrants from West Indies by Married-Couple Family Poverty
In terms of married-couple family poverty, the demographic groups most similar to Immigrants from West Indies are Immigrants from Jamaica (6.2%, a difference of 0.040%), Alaska Native (6.2%, a difference of 0.17%), Immigrants from Bahamas (6.2%, a difference of 0.26%), Trinidadian and Tobagonian (6.2%, a difference of 0.29%), and Spanish American (6.2%, a difference of 0.65%).
| Demographics | Rating | Rank | Married-Couple Family Poverty |
| Shoshone | 0.3 /100 | #262 | Tragic 6.1% |
| Immigrants | Senegal | 0.3 /100 | #263 | Tragic 6.1% |
| Immigrants | Congo | 0.2 /100 | #264 | Tragic 6.1% |
| Blackfeet | 0.2 /100 | #265 | Tragic 6.2% |
| Creek | 0.2 /100 | #266 | Tragic 6.2% |
| Spanish Americans | 0.2 /100 | #267 | Tragic 6.2% |
| Alaska Natives | 0.2 /100 | #268 | Tragic 6.2% |
| Immigrants | West Indies | 0.1 /100 | #269 | Tragic 6.2% |
| Immigrants | Jamaica | 0.1 /100 | #270 | Tragic 6.2% |
| Immigrants | Bahamas | 0.1 /100 | #271 | Tragic 6.2% |
| Trinidadians and Tobagonians | 0.1 /100 | #272 | Tragic 6.2% |
| Colville | 0.1 /100 | #273 | Tragic 6.3% |
| Barbadians | 0.1 /100 | #274 | Tragic 6.3% |
| Choctaw | 0.1 /100 | #275 | Tragic 6.3% |
| Yaqui | 0.1 /100 | #276 | Tragic 6.3% |