Cree vs Immigrants from West Indies Unemployment Among Ages 20 to 24 years
COMPARE
Cree
Immigrants from West Indies
Unemployment Among Ages 20 to 24 years
Unemployment Among Ages 20 to 24 years Comparison
Cree
Immigrants from West Indies
10.8%
UNEMPLOYMENT AMONG AGES 20 TO 24 YEARS
0.6/ 100
METRIC RATING
248th/ 347
METRIC RANK
12.3%
UNEMPLOYMENT AMONG AGES 20 TO 24 YEARS
0.0/ 100
METRIC RATING
304th/ 347
METRIC RANK
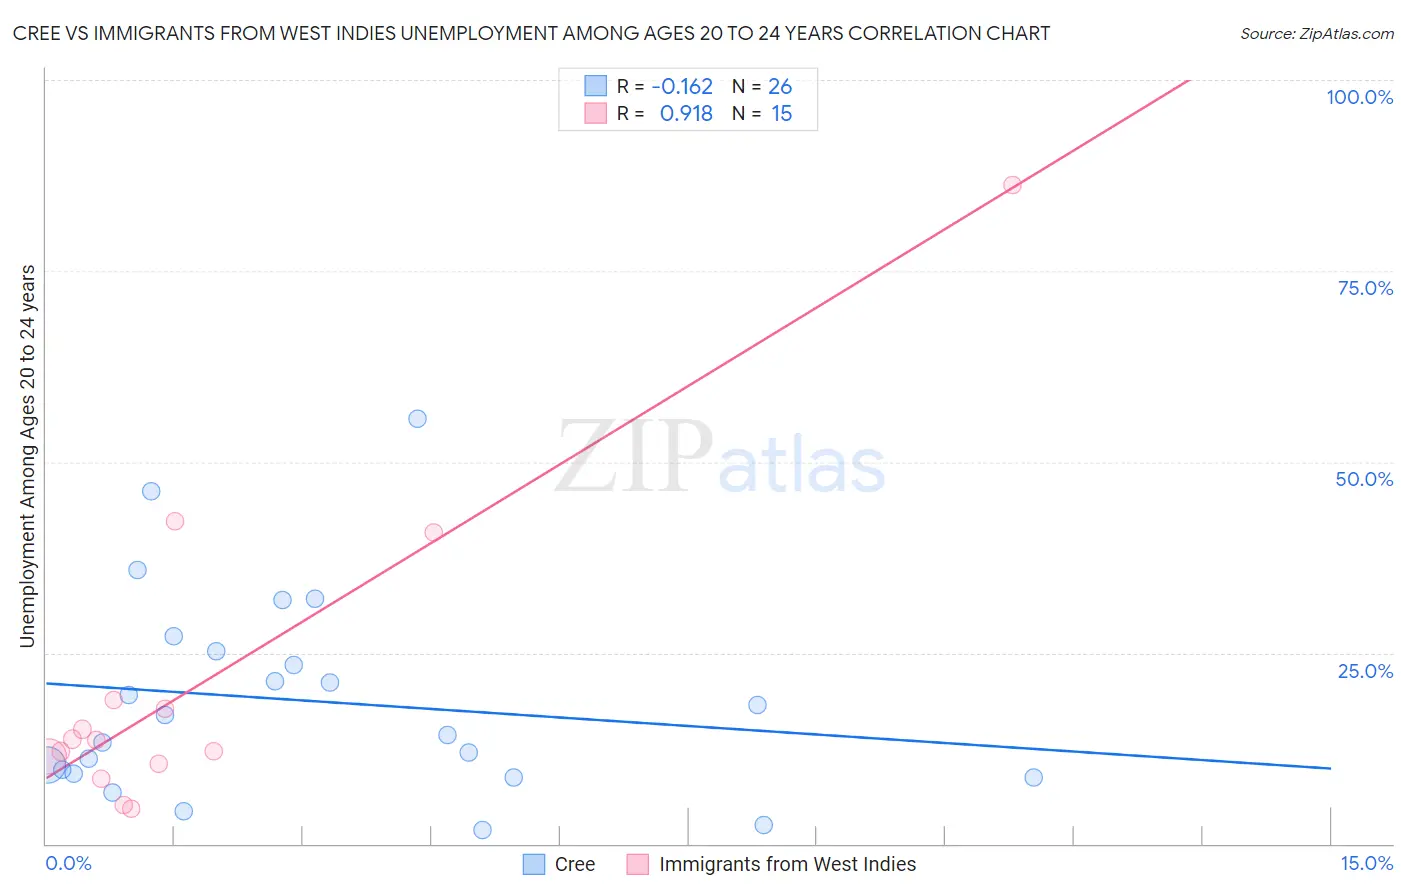
Cree vs Immigrants from West Indies Unemployment Among Ages 20 to 24 years Correlation Chart
The statistical analysis conducted on geographies consisting of 75,384,857 people shows a poor negative correlation between the proportion of Cree and unemployment rate among population between the ages 20 and 24 in the United States with a correlation coefficient (R) of -0.162 and weighted average of 10.8%. Similarly, the statistical analysis conducted on geographies consisting of 72,183,037 people shows a near-perfect positive correlation between the proportion of Immigrants from West Indies and unemployment rate among population between the ages 20 and 24 in the United States with a correlation coefficient (R) of 0.918 and weighted average of 12.3%, a difference of 14.0%.
Unemployment Among Ages 20 to 24 years Correlation Summary
| Measurement | Cree | Immigrants from West Indies |
| Minimum | 1.8% | 4.6% |
| Maximum | 55.6% | 86.2% |
| Range | 53.8% | 81.6% |
| Mean | 18.7% | 20.8% |
| Median | 15.6% | 13.6% |
| Interquartile 25% (IQ1) | 9.2% | 10.5% |
| Interquartile 75% (IQ3) | 25.2% | 18.8% |
| Interquartile Range (IQR) | 16.0% | 8.2% |
| Standard Deviation (Sample) | 13.3% | 21.2% |
| Standard Deviation (Population) | 13.0% | 20.5% |
Similar Demographics by Unemployment Among Ages 20 to 24 years
Demographics Similar to Cree by Unemployment Among Ages 20 to 24 years
In terms of unemployment among ages 20 to 24 years, the demographic groups most similar to Cree are Immigrants from Albania (10.8%, a difference of 0.10%), South American Indian (10.8%, a difference of 0.20%), Albanian (10.8%, a difference of 0.24%), Immigrants from Iran (10.8%, a difference of 0.30%), and Immigrants from Panama (10.8%, a difference of 0.30%).
| Demographics | Rating | Rank | Unemployment Among Ages 20 to 24 years |
| Immigrants | El Salvador | 1.7 /100 | #241 | Tragic 10.7% |
| Moroccans | 1.4 /100 | #242 | Tragic 10.7% |
| Immigrants | Belarus | 1.3 /100 | #243 | Tragic 10.7% |
| Immigrants | Mexico | 1.2 /100 | #244 | Tragic 10.7% |
| Hispanics or Latinos | 1.0 /100 | #245 | Tragic 10.7% |
| Immigrants | Iran | 0.9 /100 | #246 | Tragic 10.8% |
| Immigrants | Albania | 0.7 /100 | #247 | Tragic 10.8% |
| Cree | 0.6 /100 | #248 | Tragic 10.8% |
| South American Indians | 0.5 /100 | #249 | Tragic 10.8% |
| Albanians | 0.5 /100 | #250 | Tragic 10.8% |
| Immigrants | Panama | 0.4 /100 | #251 | Tragic 10.8% |
| Immigrants | Syria | 0.4 /100 | #252 | Tragic 10.8% |
| Spanish Americans | 0.4 /100 | #253 | Tragic 10.8% |
| Liberians | 0.3 /100 | #254 | Tragic 10.8% |
| Immigrants | Israel | 0.3 /100 | #255 | Tragic 10.8% |
Demographics Similar to Immigrants from West Indies by Unemployment Among Ages 20 to 24 years
In terms of unemployment among ages 20 to 24 years, the demographic groups most similar to Immigrants from West Indies are Chippewa (12.3%, a difference of 0.040%), Haitian (12.2%, a difference of 0.59%), Immigrants from Cabo Verde (12.2%, a difference of 0.61%), Immigrants from Haiti (12.4%, a difference of 0.88%), and Bermudan (12.5%, a difference of 1.3%).
| Demographics | Rating | Rank | Unemployment Among Ages 20 to 24 years |
| Blackfeet | 0.0 /100 | #297 | Tragic 12.0% |
| Lumbee | 0.0 /100 | #298 | Tragic 12.0% |
| Apache | 0.0 /100 | #299 | Tragic 12.0% |
| Spanish American Indians | 0.0 /100 | #300 | Tragic 12.1% |
| Immigrants | Sierra Leone | 0.0 /100 | #301 | Tragic 12.1% |
| Immigrants | Cabo Verde | 0.0 /100 | #302 | Tragic 12.2% |
| Haitians | 0.0 /100 | #303 | Tragic 12.2% |
| Immigrants | West Indies | 0.0 /100 | #304 | Tragic 12.3% |
| Chippewa | 0.0 /100 | #305 | Tragic 12.3% |
| Immigrants | Haiti | 0.0 /100 | #306 | Tragic 12.4% |
| Bermudans | 0.0 /100 | #307 | Tragic 12.5% |
| Tohono O'odham | 0.0 /100 | #308 | Tragic 12.5% |
| Immigrants | Bangladesh | 0.0 /100 | #309 | Tragic 12.6% |
| Jamaicans | 0.0 /100 | #310 | Tragic 12.6% |
| Vietnamese | 0.0 /100 | #311 | Tragic 12.6% |