Cree vs Immigrants from West Indies Bachelor's Degree
COMPARE
Cree
Immigrants from West Indies
Bachelor's Degree
Bachelor's Degree Comparison
Cree
Immigrants from West Indies
33.6%
BACHELOR'S DEGREE
1.0/ 100
METRIC RATING
248th/ 347
METRIC RANK
34.6%
BACHELOR'S DEGREE
2.9/ 100
METRIC RATING
235th/ 347
METRIC RANK
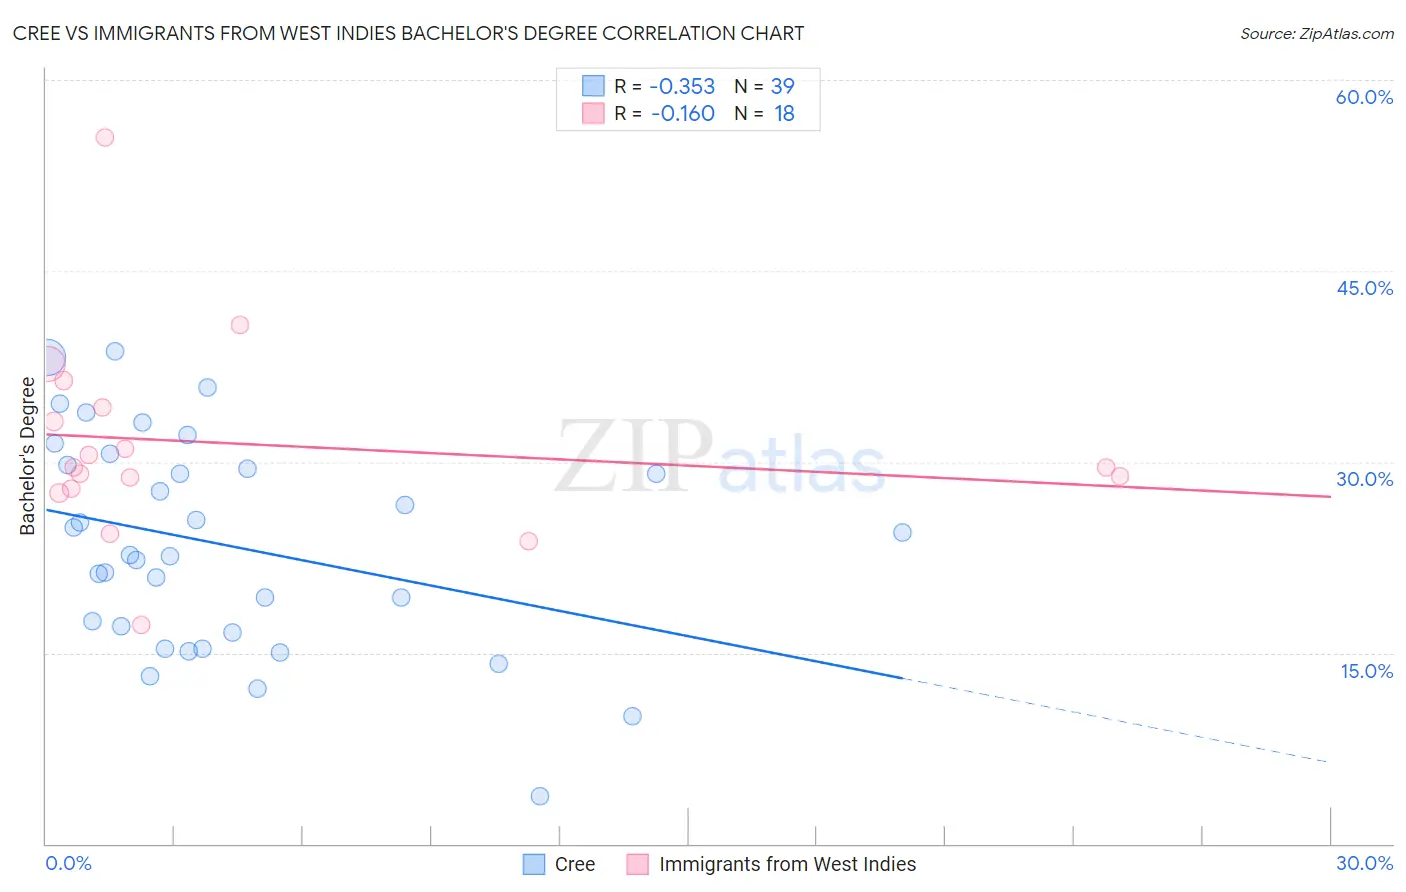
Cree vs Immigrants from West Indies Bachelor's Degree Correlation Chart
The statistical analysis conducted on geographies consisting of 76,210,625 people shows a mild negative correlation between the proportion of Cree and percentage of population with at least bachelor's degree education in the United States with a correlation coefficient (R) of -0.353 and weighted average of 33.6%. Similarly, the statistical analysis conducted on geographies consisting of 72,420,477 people shows a poor negative correlation between the proportion of Immigrants from West Indies and percentage of population with at least bachelor's degree education in the United States with a correlation coefficient (R) of -0.160 and weighted average of 34.6%, a difference of 3.0%.
Bachelor's Degree Correlation Summary
| Measurement | Cree | Immigrants from West Indies |
| Minimum | 3.8% | 17.2% |
| Maximum | 38.7% | 55.5% |
| Range | 34.9% | 38.3% |
| Mean | 23.5% | 31.4% |
| Median | 22.6% | 29.5% |
| Interquartile 25% (IQ1) | 16.6% | 27.8% |
| Interquartile 75% (IQ3) | 29.7% | 34.3% |
| Interquartile Range (IQR) | 13.1% | 6.4% |
| Standard Deviation (Sample) | 8.3% | 8.1% |
| Standard Deviation (Population) | 8.2% | 7.8% |
Demographics Similar to Cree and Immigrants from West Indies by Bachelor's Degree
In terms of bachelor's degree, the demographic groups most similar to Cree are Immigrants from Congo (33.6%, a difference of 0.010%), Jamaican (33.6%, a difference of 0.10%), Immigrants from Liberia (33.5%, a difference of 0.13%), Indonesian (33.5%, a difference of 0.13%), and Immigrants from Fiji (33.7%, a difference of 0.47%). Similarly, the demographic groups most similar to Immigrants from West Indies are Guamanian/Chamorro (34.6%, a difference of 0.090%), Liberian (34.6%, a difference of 0.11%), Tlingit-Haida (34.6%, a difference of 0.14%), Immigrants from Ecuador (34.7%, a difference of 0.31%), and Hmong (34.8%, a difference of 0.42%).
| Demographics | Rating | Rank | Bachelor's Degree |
| Immigrants | St. Vincent and the Grenadines | 4.3 /100 | #231 | Tragic 35.0% |
| Hmong | 3.4 /100 | #232 | Tragic 34.8% |
| Immigrants | Ecuador | 3.3 /100 | #233 | Tragic 34.7% |
| Guamanians/Chamorros | 3.0 /100 | #234 | Tragic 34.6% |
| Immigrants | West Indies | 2.9 /100 | #235 | Tragic 34.6% |
| Liberians | 2.8 /100 | #236 | Tragic 34.6% |
| Tlingit-Haida | 2.8 /100 | #237 | Tragic 34.6% |
| Guyanese | 2.5 /100 | #238 | Tragic 34.5% |
| British West Indians | 2.5 /100 | #239 | Tragic 34.5% |
| Tongans | 2.0 /100 | #240 | Tragic 34.3% |
| Immigrants | Cambodia | 1.9 /100 | #241 | Tragic 34.2% |
| Immigrants | Nonimmigrants | 1.8 /100 | #242 | Tragic 34.2% |
| Immigrants | Guyana | 1.4 /100 | #243 | Tragic 33.9% |
| Delaware | 1.2 /100 | #244 | Tragic 33.8% |
| Immigrants | Fiji | 1.2 /100 | #245 | Tragic 33.7% |
| Jamaicans | 1.0 /100 | #246 | Tragic 33.6% |
| Immigrants | Congo | 1.0 /100 | #247 | Tragic 33.6% |
| Cree | 1.0 /100 | #248 | Tragic 33.6% |
| Immigrants | Liberia | 0.9 /100 | #249 | Tragic 33.5% |
| Indonesians | 0.9 /100 | #250 | Tragic 33.5% |
| Japanese | 0.7 /100 | #251 | Tragic 33.3% |