Costa Rican vs Egyptian Male Poverty
COMPARE
Costa Rican
Egyptian
Male Poverty
Male Poverty Comparison
Costa Ricans
Egyptians
11.0%
MALE POVERTY
63.9/ 100
METRIC RATING
156th/ 347
METRIC RANK
10.3%
MALE POVERTY
95.9/ 100
METRIC RATING
82nd/ 347
METRIC RANK
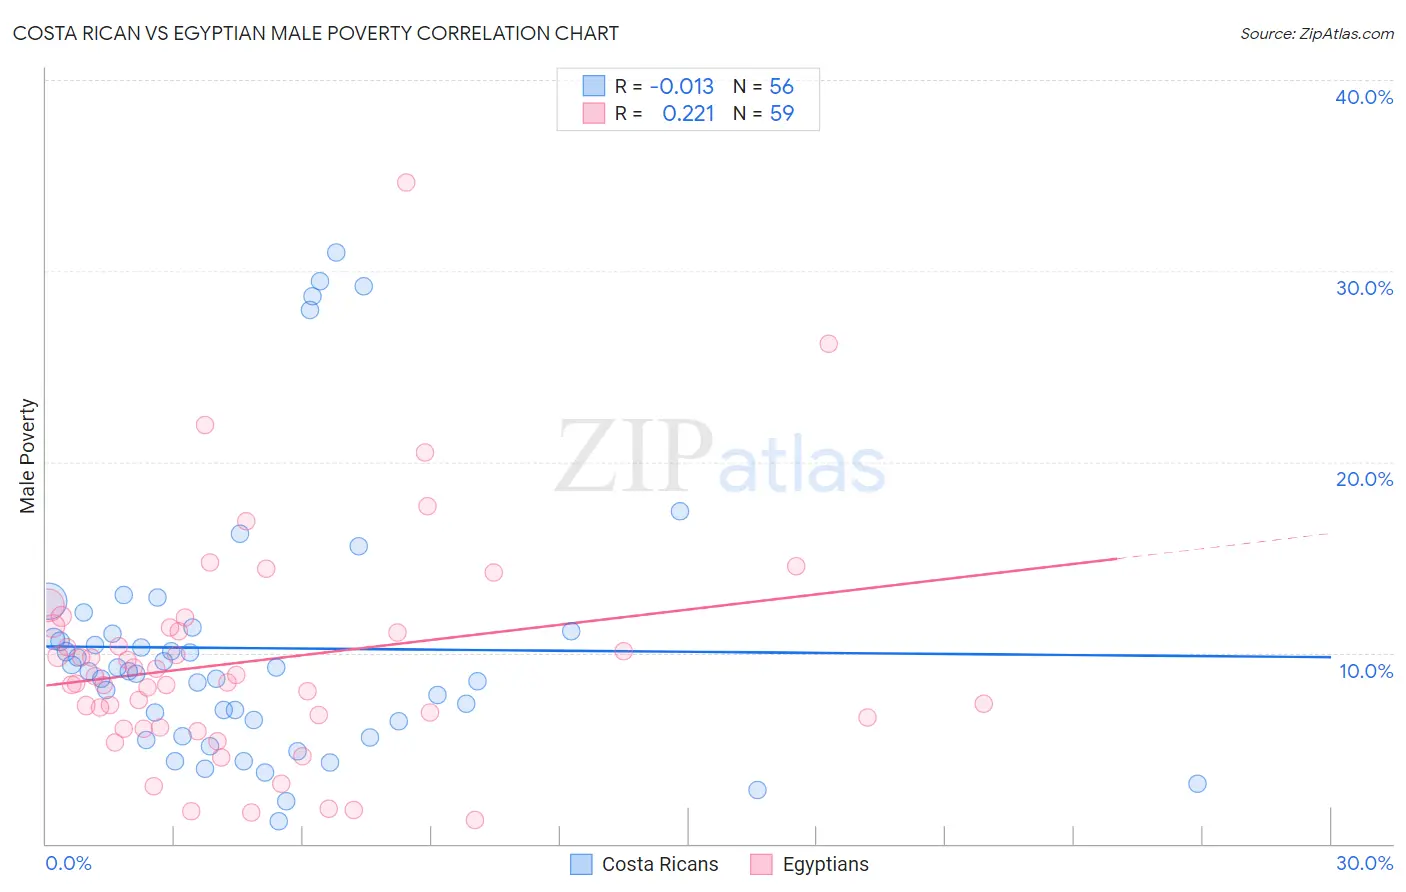
Costa Rican vs Egyptian Male Poverty Correlation Chart
The statistical analysis conducted on geographies consisting of 253,451,633 people shows no correlation between the proportion of Costa Ricans and poverty level among males in the United States with a correlation coefficient (R) of -0.013 and weighted average of 11.0%. Similarly, the statistical analysis conducted on geographies consisting of 276,705,416 people shows a weak positive correlation between the proportion of Egyptians and poverty level among males in the United States with a correlation coefficient (R) of 0.221 and weighted average of 10.3%, a difference of 6.8%.
Male Poverty Correlation Summary
| Measurement | Costa Rican | Egyptian |
| Minimum | 1.1% | 1.2% |
| Maximum | 31.0% | 34.6% |
| Range | 29.8% | 33.4% |
| Mean | 10.2% | 9.6% |
| Median | 9.0% | 8.4% |
| Interquartile 25% (IQ1) | 6.0% | 6.1% |
| Interquartile 75% (IQ3) | 11.0% | 11.3% |
| Interquartile Range (IQR) | 5.0% | 5.2% |
| Standard Deviation (Sample) | 6.9% | 5.9% |
| Standard Deviation (Population) | 6.8% | 5.9% |
Similar Demographics by Male Poverty
Demographics Similar to Costa Ricans by Male Poverty
In terms of male poverty, the demographic groups most similar to Costa Ricans are Scotch-Irish (11.0%, a difference of 0.020%), Immigrants from Malaysia (11.0%, a difference of 0.090%), Immigrants from Kazakhstan (11.0%, a difference of 0.10%), Colombian (11.0%, a difference of 0.10%), and Taiwanese (11.0%, a difference of 0.12%).
| Demographics | Rating | Rank | Male Poverty |
| Immigrants | Venezuela | 67.9 /100 | #149 | Good 11.0% |
| Guamanians/Chamorros | 67.6 /100 | #150 | Good 11.0% |
| Venezuelans | 67.4 /100 | #151 | Good 11.0% |
| Immigrants | Nepal | 67.3 /100 | #152 | Good 11.0% |
| Immigrants | Bosnia and Herzegovina | 65.2 /100 | #153 | Good 11.0% |
| Immigrants | Kazakhstan | 64.8 /100 | #154 | Good 11.0% |
| Immigrants | Malaysia | 64.7 /100 | #155 | Good 11.0% |
| Costa Ricans | 63.9 /100 | #156 | Good 11.0% |
| Scotch-Irish | 63.7 /100 | #157 | Good 11.0% |
| Colombians | 63.0 /100 | #158 | Good 11.0% |
| Taiwanese | 62.7 /100 | #159 | Good 11.0% |
| Soviet Union | 60.3 /100 | #160 | Good 11.1% |
| Immigrants | Northern Africa | 59.7 /100 | #161 | Average 11.1% |
| Immigrants | Chile | 57.4 /100 | #162 | Average 11.1% |
| Whites/Caucasians | 56.7 /100 | #163 | Average 11.1% |
Demographics Similar to Egyptians by Male Poverty
In terms of male poverty, the demographic groups most similar to Egyptians are Belgian (10.3%, a difference of 0.0%), Immigrants from Sweden (10.3%, a difference of 0.12%), Czechoslovakian (10.3%, a difference of 0.19%), Immigrants from England (10.4%, a difference of 0.23%), and Immigrants from Eastern Asia (10.4%, a difference of 0.37%).
| Demographics | Rating | Rank | Male Poverty |
| Carpatho Rusyns | 96.9 /100 | #75 | Exceptional 10.2% |
| Dutch | 96.9 /100 | #76 | Exceptional 10.2% |
| Immigrants | Belgium | 96.8 /100 | #77 | Exceptional 10.3% |
| Irish | 96.8 /100 | #78 | Exceptional 10.3% |
| Immigrants | North America | 96.5 /100 | #79 | Exceptional 10.3% |
| English | 96.4 /100 | #80 | Exceptional 10.3% |
| Belgians | 95.9 /100 | #81 | Exceptional 10.3% |
| Egyptians | 95.9 /100 | #82 | Exceptional 10.3% |
| Immigrants | Sweden | 95.7 /100 | #83 | Exceptional 10.3% |
| Czechoslovakians | 95.6 /100 | #84 | Exceptional 10.3% |
| Immigrants | England | 95.5 /100 | #85 | Exceptional 10.4% |
| Immigrants | Eastern Asia | 95.3 /100 | #86 | Exceptional 10.4% |
| Northern Europeans | 95.2 /100 | #87 | Exceptional 10.4% |
| Cambodians | 95.0 /100 | #88 | Exceptional 10.4% |
| Immigrants | Denmark | 95.0 /100 | #89 | Exceptional 10.4% |