Costa Rican vs Alsatian Male Poverty
COMPARE
Costa Rican
Alsatian
Male Poverty
Male Poverty Comparison
Costa Ricans
Alsatians
11.0%
MALE POVERTY
63.9/ 100
METRIC RATING
156th/ 347
METRIC RANK
12.4%
MALE POVERTY
1.3/ 100
METRIC RATING
228th/ 347
METRIC RANK
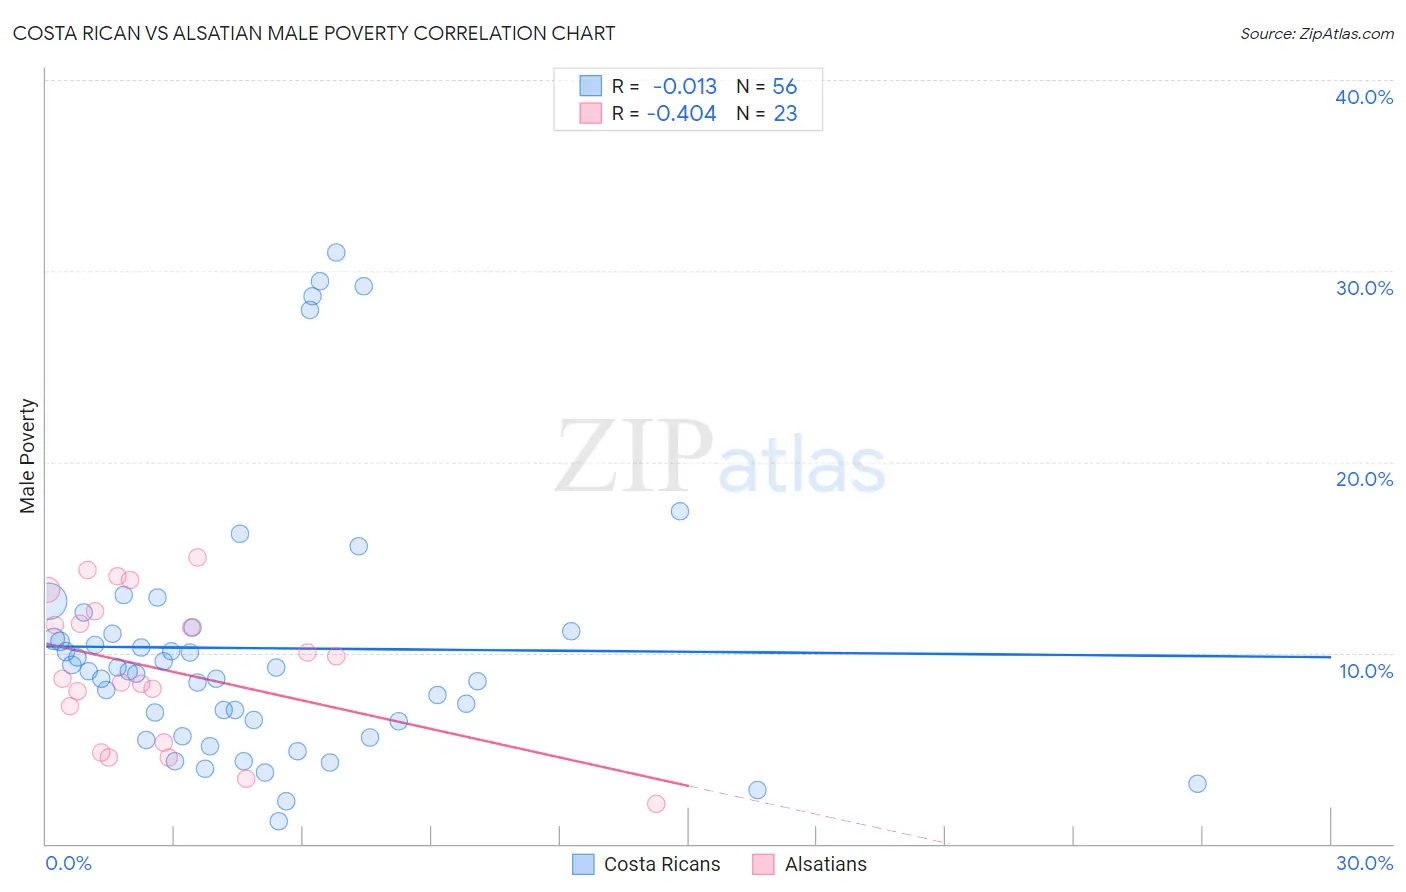
Costa Rican vs Alsatian Male Poverty Correlation Chart
The statistical analysis conducted on geographies consisting of 253,451,633 people shows no correlation between the proportion of Costa Ricans and poverty level among males in the United States with a correlation coefficient (R) of -0.013 and weighted average of 11.0%. Similarly, the statistical analysis conducted on geographies consisting of 82,673,926 people shows a moderate negative correlation between the proportion of Alsatians and poverty level among males in the United States with a correlation coefficient (R) of -0.404 and weighted average of 12.4%, a difference of 12.1%.
Male Poverty Correlation Summary
| Measurement | Costa Rican | Alsatian |
| Minimum | 1.1% | 2.1% |
| Maximum | 31.0% | 15.0% |
| Range | 29.8% | 12.9% |
| Mean | 10.2% | 9.1% |
| Median | 9.0% | 8.6% |
| Interquartile 25% (IQ1) | 6.0% | 5.3% |
| Interquartile 75% (IQ3) | 11.0% | 12.2% |
| Interquartile Range (IQR) | 5.0% | 6.9% |
| Standard Deviation (Sample) | 6.9% | 3.8% |
| Standard Deviation (Population) | 6.8% | 3.7% |
Similar Demographics by Male Poverty
Demographics Similar to Costa Ricans by Male Poverty
In terms of male poverty, the demographic groups most similar to Costa Ricans are Scotch-Irish (11.0%, a difference of 0.020%), Immigrants from Malaysia (11.0%, a difference of 0.090%), Immigrants from Kazakhstan (11.0%, a difference of 0.10%), Colombian (11.0%, a difference of 0.10%), and Taiwanese (11.0%, a difference of 0.12%).
| Demographics | Rating | Rank | Male Poverty |
| Immigrants | Venezuela | 67.9 /100 | #149 | Good 11.0% |
| Guamanians/Chamorros | 67.6 /100 | #150 | Good 11.0% |
| Venezuelans | 67.4 /100 | #151 | Good 11.0% |
| Immigrants | Nepal | 67.3 /100 | #152 | Good 11.0% |
| Immigrants | Bosnia and Herzegovina | 65.2 /100 | #153 | Good 11.0% |
| Immigrants | Kazakhstan | 64.8 /100 | #154 | Good 11.0% |
| Immigrants | Malaysia | 64.7 /100 | #155 | Good 11.0% |
| Costa Ricans | 63.9 /100 | #156 | Good 11.0% |
| Scotch-Irish | 63.7 /100 | #157 | Good 11.0% |
| Colombians | 63.0 /100 | #158 | Good 11.0% |
| Taiwanese | 62.7 /100 | #159 | Good 11.0% |
| Soviet Union | 60.3 /100 | #160 | Good 11.1% |
| Immigrants | Northern Africa | 59.7 /100 | #161 | Average 11.1% |
| Immigrants | Chile | 57.4 /100 | #162 | Average 11.1% |
| Whites/Caucasians | 56.7 /100 | #163 | Average 11.1% |
Demographics Similar to Alsatians by Male Poverty
In terms of male poverty, the demographic groups most similar to Alsatians are Alaska Native (12.4%, a difference of 0.040%), Cuban (12.4%, a difference of 0.090%), Nigerian (12.3%, a difference of 0.13%), Osage (12.3%, a difference of 0.30%), and Immigrants from Nigeria (12.3%, a difference of 0.36%).
| Demographics | Rating | Rank | Male Poverty |
| Ugandans | 2.2 /100 | #221 | Tragic 12.2% |
| Immigrants | Africa | 2.1 /100 | #222 | Tragic 12.2% |
| Immigrants | Micronesia | 2.1 /100 | #223 | Tragic 12.2% |
| Immigrants | Nigeria | 1.6 /100 | #224 | Tragic 12.3% |
| Osage | 1.5 /100 | #225 | Tragic 12.3% |
| Nigerians | 1.4 /100 | #226 | Tragic 12.3% |
| Alaska Natives | 1.4 /100 | #227 | Tragic 12.4% |
| Alsatians | 1.3 /100 | #228 | Tragic 12.4% |
| Cubans | 1.3 /100 | #229 | Tragic 12.4% |
| Marshallese | 0.8 /100 | #230 | Tragic 12.5% |
| Salvadorans | 0.6 /100 | #231 | Tragic 12.6% |
| Nicaraguans | 0.6 /100 | #232 | Tragic 12.6% |
| Fijians | 0.6 /100 | #233 | Tragic 12.6% |
| Immigrants | Armenia | 0.6 /100 | #234 | Tragic 12.6% |
| Immigrants | Laos | 0.5 /100 | #235 | Tragic 12.6% |