Chippewa vs Alaskan Athabascan Married-Couple Family Poverty
COMPARE
Chippewa
Alaskan Athabascan
Married-Couple Family Poverty
Married-Couple Family Poverty Comparison
Chippewa
Alaskan Athabascans
5.4%
MARRIED-COUPLE FAMILY POVERTY
18.9/ 100
METRIC RATING
205th/ 347
METRIC RANK
6.1%
MARRIED-COUPLE FAMILY POVERTY
0.4/ 100
METRIC RATING
259th/ 347
METRIC RANK
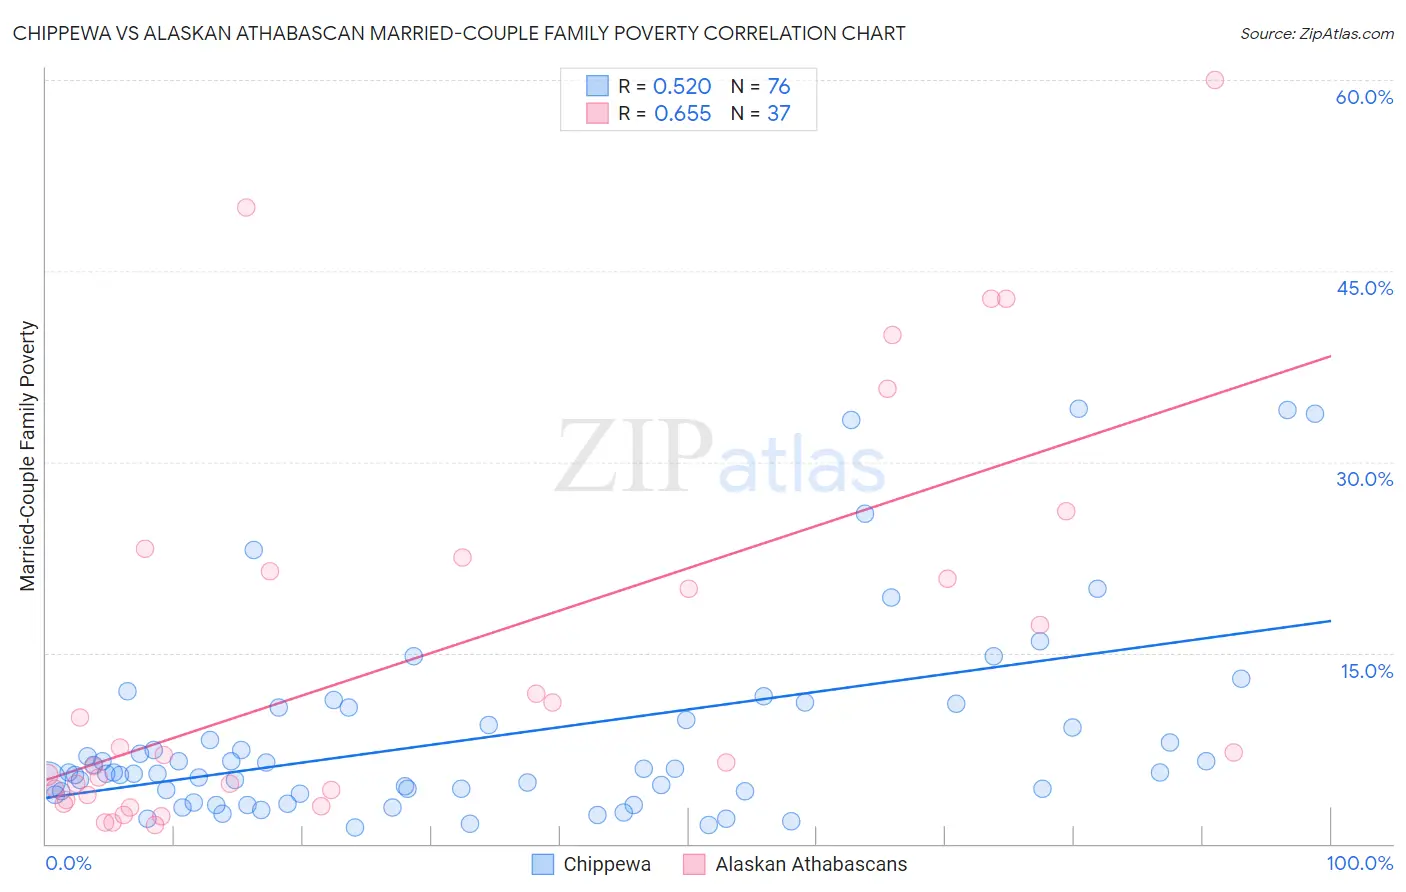
Chippewa vs Alaskan Athabascan Married-Couple Family Poverty Correlation Chart
The statistical analysis conducted on geographies consisting of 213,662,644 people shows a substantial positive correlation between the proportion of Chippewa and poverty level among married-couple families in the United States with a correlation coefficient (R) of 0.520 and weighted average of 5.4%. Similarly, the statistical analysis conducted on geographies consisting of 45,695,743 people shows a significant positive correlation between the proportion of Alaskan Athabascans and poverty level among married-couple families in the United States with a correlation coefficient (R) of 0.655 and weighted average of 6.1%, a difference of 11.5%.
Married-Couple Family Poverty Correlation Summary
| Measurement | Chippewa | Alaskan Athabascan |
| Minimum | 1.3% | 1.5% |
| Maximum | 34.1% | 60.0% |
| Range | 32.9% | 58.5% |
| Mean | 8.4% | 14.7% |
| Median | 5.6% | 7.0% |
| Interquartile 25% (IQ1) | 4.0% | 3.6% |
| Interquartile 75% (IQ3) | 10.2% | 21.9% |
| Interquartile Range (IQR) | 6.2% | 18.3% |
| Standard Deviation (Sample) | 7.8% | 15.6% |
| Standard Deviation (Population) | 7.7% | 15.4% |
Similar Demographics by Married-Couple Family Poverty
Demographics Similar to Chippewa by Married-Couple Family Poverty
In terms of married-couple family poverty, the demographic groups most similar to Chippewa are Immigrants from Costa Rica (5.4%, a difference of 0.080%), Osage (5.4%, a difference of 0.10%), Immigrants from Africa (5.5%, a difference of 0.24%), Immigrants from Peru (5.4%, a difference of 0.49%), and French American Indian (5.5%, a difference of 0.56%).
| Demographics | Rating | Rank | Married-Couple Family Poverty |
| Immigrants | Belarus | 26.2 /100 | #198 | Fair 5.4% |
| Uruguayans | 25.0 /100 | #199 | Fair 5.4% |
| Immigrants | Morocco | 24.3 /100 | #200 | Fair 5.4% |
| Lebanese | 24.1 /100 | #201 | Fair 5.4% |
| Immigrants | Middle Africa | 23.8 /100 | #202 | Fair 5.4% |
| Immigrants | Peru | 21.8 /100 | #203 | Fair 5.4% |
| Immigrants | Costa Rica | 19.4 /100 | #204 | Poor 5.4% |
| Chippewa | 18.9 /100 | #205 | Poor 5.4% |
| Osage | 18.4 /100 | #206 | Poor 5.4% |
| Immigrants | Africa | 17.6 /100 | #207 | Poor 5.5% |
| French American Indians | 16.1 /100 | #208 | Poor 5.5% |
| Immigrants | Syria | 15.4 /100 | #209 | Poor 5.5% |
| Immigrants | Micronesia | 14.4 /100 | #210 | Poor 5.5% |
| Nigerians | 14.3 /100 | #211 | Poor 5.5% |
| Immigrants | Thailand | 14.0 /100 | #212 | Poor 5.5% |
Demographics Similar to Alaskan Athabascans by Married-Couple Family Poverty
In terms of married-couple family poverty, the demographic groups most similar to Alaskan Athabascans are Jamaican (6.1%, a difference of 0.21%), Senegalese (6.1%, a difference of 0.40%), Immigrants (6.0%, a difference of 0.58%), Shoshone (6.1%, a difference of 0.61%), and Immigrants from Burma/Myanmar (6.0%, a difference of 0.71%).
| Demographics | Rating | Rank | Married-Couple Family Poverty |
| Immigrants | Western Asia | 0.7 /100 | #252 | Tragic 6.0% |
| Africans | 0.7 /100 | #253 | Tragic 6.0% |
| Immigrants | Somalia | 0.7 /100 | #254 | Tragic 6.0% |
| Comanche | 0.7 /100 | #255 | Tragic 6.0% |
| Bangladeshis | 0.5 /100 | #256 | Tragic 6.0% |
| Immigrants | Burma/Myanmar | 0.5 /100 | #257 | Tragic 6.0% |
| Immigrants | Immigrants | 0.5 /100 | #258 | Tragic 6.0% |
| Alaskan Athabascans | 0.4 /100 | #259 | Tragic 6.1% |
| Jamaicans | 0.3 /100 | #260 | Tragic 6.1% |
| Senegalese | 0.3 /100 | #261 | Tragic 6.1% |
| Shoshone | 0.3 /100 | #262 | Tragic 6.1% |
| Immigrants | Senegal | 0.3 /100 | #263 | Tragic 6.1% |
| Immigrants | Congo | 0.2 /100 | #264 | Tragic 6.1% |
| Blackfeet | 0.2 /100 | #265 | Tragic 6.2% |
| Creek | 0.2 /100 | #266 | Tragic 6.2% |