Chippewa vs Alaskan Athabascan Unemployment Among Women with Children Under 18 years
COMPARE
Chippewa
Alaskan Athabascan
Unemployment Among Women with Children Under 18 years
Unemployment Among Women with Children Under 18 years Comparison
Chippewa
Alaskan Athabascans
7.0%
UNEMPLOYMENT AMONG WOMEN WITH CHILDREN UNDER 18 YEARS
0.0/ 100
METRIC RATING
326th/ 347
METRIC RANK
6.3%
UNEMPLOYMENT AMONG WOMEN WITH CHILDREN UNDER 18 YEARS
0.0/ 100
METRIC RATING
286th/ 347
METRIC RANK
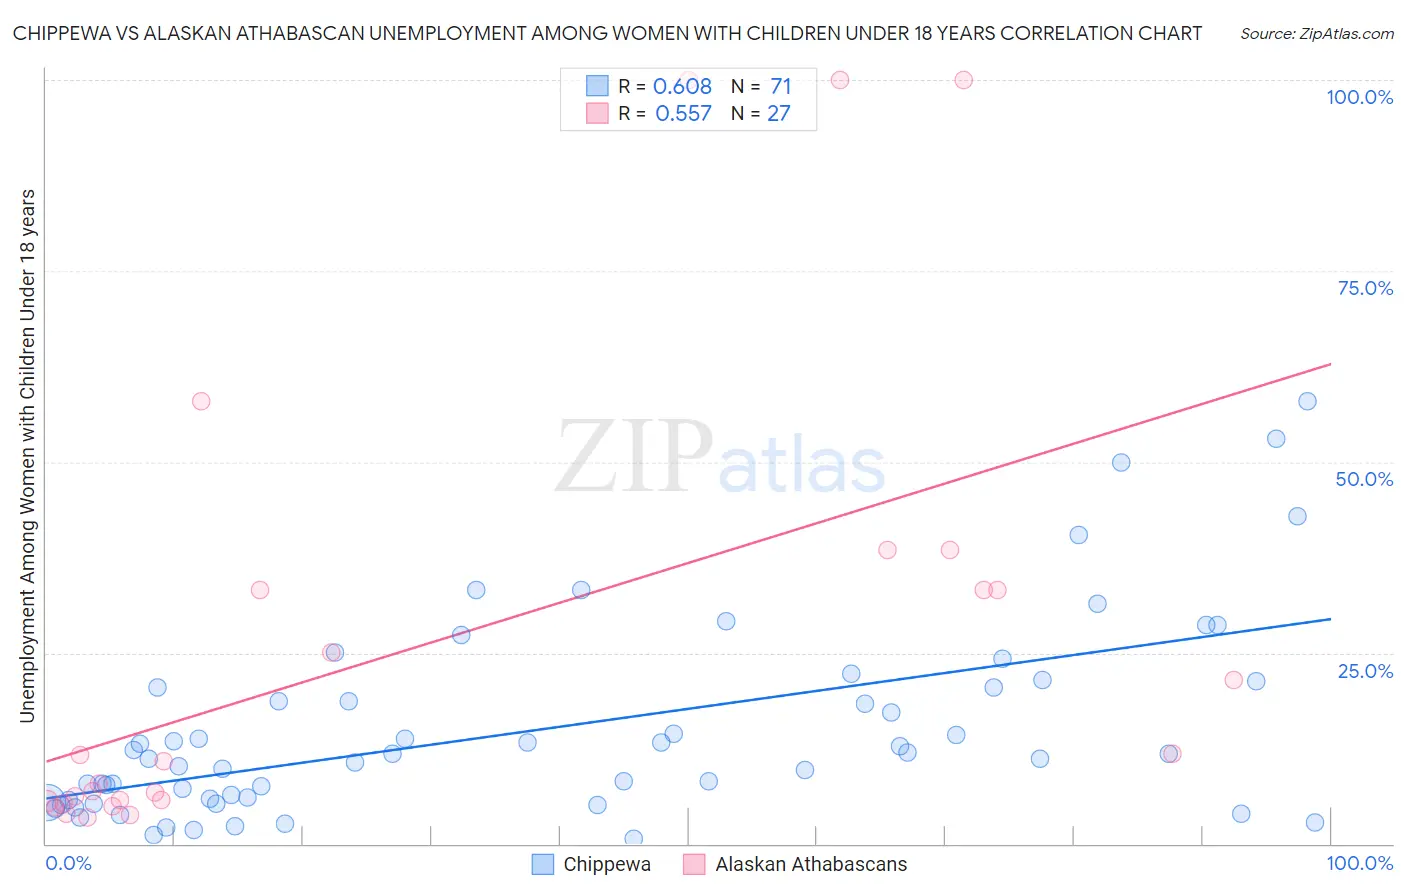
Chippewa vs Alaskan Athabascan Unemployment Among Women with Children Under 18 years Correlation Chart
The statistical analysis conducted on geographies consisting of 207,005,580 people shows a significant positive correlation between the proportion of Chippewa and unemployment rate among women with children under the age of 18 in the United States with a correlation coefficient (R) of 0.608 and weighted average of 7.0%. Similarly, the statistical analysis conducted on geographies consisting of 45,206,259 people shows a substantial positive correlation between the proportion of Alaskan Athabascans and unemployment rate among women with children under the age of 18 in the United States with a correlation coefficient (R) of 0.557 and weighted average of 6.3%, a difference of 10.9%.
Unemployment Among Women with Children Under 18 years Correlation Summary
| Measurement | Chippewa | Alaskan Athabascan |
| Minimum | 0.70% | 3.4% |
| Maximum | 57.9% | 100.0% |
| Range | 57.2% | 96.6% |
| Mean | 15.0% | 25.4% |
| Median | 11.7% | 10.8% |
| Interquartile 25% (IQ1) | 5.7% | 5.6% |
| Interquartile 75% (IQ3) | 20.5% | 33.3% |
| Interquartile Range (IQR) | 14.7% | 27.7% |
| Standard Deviation (Sample) | 12.7% | 30.4% |
| Standard Deviation (Population) | 12.6% | 29.9% |
Similar Demographics by Unemployment Among Women with Children Under 18 years
Demographics Similar to Chippewa by Unemployment Among Women with Children Under 18 years
In terms of unemployment among women with children under 18 years, the demographic groups most similar to Chippewa are Immigrants from Dominica (7.0%, a difference of 0.71%), Lumbee (7.1%, a difference of 0.86%), Paiute (6.9%, a difference of 1.9%), Pueblo (6.8%, a difference of 2.9%), and Houma (6.8%, a difference of 3.1%).
| Demographics | Rating | Rank | Unemployment Among Women with Children Under 18 years |
| Central American Indians | 0.0 /100 | #319 | Tragic 6.7% |
| Immigrants | Belize | 0.0 /100 | #320 | Tragic 6.7% |
| U.S. Virgin Islanders | 0.0 /100 | #321 | Tragic 6.7% |
| Houma | 0.0 /100 | #322 | Tragic 6.8% |
| Pueblo | 0.0 /100 | #323 | Tragic 6.8% |
| Paiute | 0.0 /100 | #324 | Tragic 6.9% |
| Immigrants | Dominica | 0.0 /100 | #325 | Tragic 7.0% |
| Chippewa | 0.0 /100 | #326 | Tragic 7.0% |
| Lumbee | 0.0 /100 | #327 | Tragic 7.1% |
| Natives/Alaskans | 0.0 /100 | #328 | Tragic 7.2% |
| Blacks/African Americans | 0.0 /100 | #329 | Tragic 7.3% |
| Colville | 0.0 /100 | #330 | Tragic 7.4% |
| Hopi | 0.0 /100 | #331 | Tragic 7.4% |
| Dominicans | 0.0 /100 | #332 | Tragic 7.5% |
| Immigrants | Dominican Republic | 0.0 /100 | #333 | Tragic 7.5% |
Demographics Similar to Alaskan Athabascans by Unemployment Among Women with Children Under 18 years
In terms of unemployment among women with children under 18 years, the demographic groups most similar to Alaskan Athabascans are Kiowa (6.3%, a difference of 0.010%), Cree (6.3%, a difference of 0.13%), Bahamian (6.3%, a difference of 0.15%), Immigrants from Grenada (6.3%, a difference of 0.30%), and West Indian (6.3%, a difference of 0.33%).
| Demographics | Rating | Rank | Unemployment Among Women with Children Under 18 years |
| Immigrants | Portugal | 0.0 /100 | #279 | Tragic 6.3% |
| Guatemalans | 0.0 /100 | #280 | Tragic 6.3% |
| Immigrants | El Salvador | 0.0 /100 | #281 | Tragic 6.3% |
| Immigrants | St. Vincent and the Grenadines | 0.0 /100 | #282 | Tragic 6.3% |
| West Indians | 0.0 /100 | #283 | Tragic 6.3% |
| Immigrants | Grenada | 0.0 /100 | #284 | Tragic 6.3% |
| Bahamians | 0.0 /100 | #285 | Tragic 6.3% |
| Alaskan Athabascans | 0.0 /100 | #286 | Tragic 6.3% |
| Kiowa | 0.0 /100 | #287 | Tragic 6.3% |
| Cree | 0.0 /100 | #288 | Tragic 6.3% |
| Immigrants | Caribbean | 0.0 /100 | #289 | Tragic 6.4% |
| Blackfeet | 0.0 /100 | #290 | Tragic 6.4% |
| Immigrants | Guatemala | 0.0 /100 | #291 | Tragic 6.4% |
| Mexicans | 0.0 /100 | #292 | Tragic 6.4% |
| Immigrants | Bangladesh | 0.0 /100 | #293 | Tragic 6.4% |