Chickasaw vs Samoan Single Male Poverty
COMPARE
Chickasaw
Samoan
Single Male Poverty
Single Male Poverty Comparison
Chickasaw
Samoans
16.3%
SINGLE MALE POVERTY
0.0/ 100
METRIC RATING
318th/ 347
METRIC RANK
11.7%
SINGLE MALE POVERTY
99.9/ 100
METRIC RATING
52nd/ 347
METRIC RANK
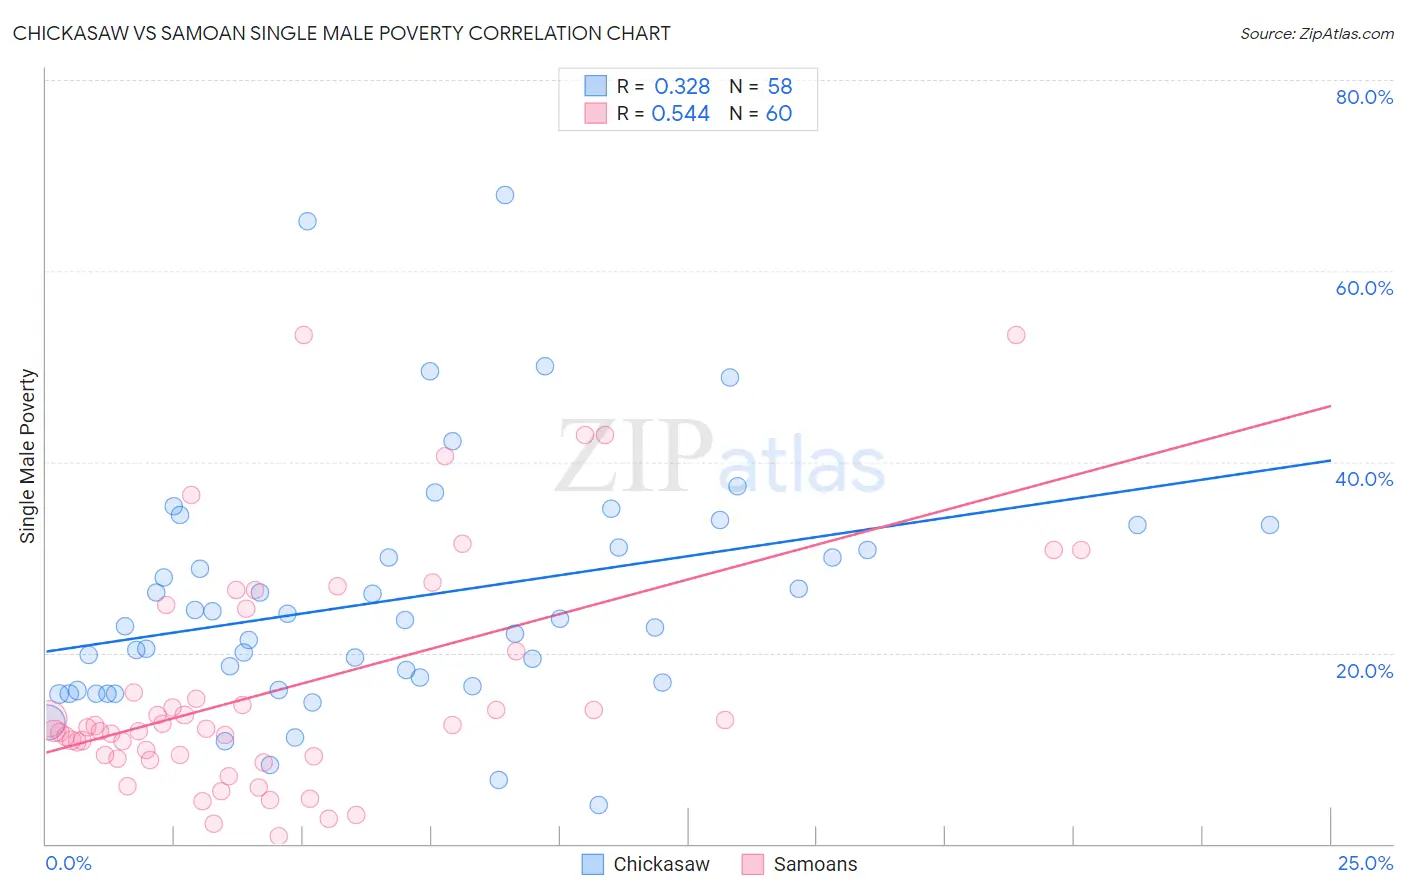
Chickasaw vs Samoan Single Male Poverty Correlation Chart
The statistical analysis conducted on geographies consisting of 140,053,704 people shows a mild positive correlation between the proportion of Chickasaw and poverty level among single males in the United States with a correlation coefficient (R) of 0.328 and weighted average of 16.3%. Similarly, the statistical analysis conducted on geographies consisting of 211,659,255 people shows a substantial positive correlation between the proportion of Samoans and poverty level among single males in the United States with a correlation coefficient (R) of 0.544 and weighted average of 11.7%, a difference of 40.0%.
Single Male Poverty Correlation Summary
| Measurement | Chickasaw | Samoan |
| Minimum | 4.0% | 0.75% |
| Maximum | 67.9% | 53.3% |
| Range | 63.9% | 52.6% |
| Mean | 25.6% | 16.3% |
| Median | 23.1% | 12.1% |
| Interquartile 25% (IQ1) | 16.6% | 9.2% |
| Interquartile 75% (IQ3) | 31.0% | 22.4% |
| Interquartile Range (IQR) | 14.5% | 13.2% |
| Standard Deviation (Sample) | 12.7% | 12.2% |
| Standard Deviation (Population) | 12.6% | 12.1% |
Similar Demographics by Single Male Poverty
Demographics Similar to Chickasaw by Single Male Poverty
In terms of single male poverty, the demographic groups most similar to Chickasaw are Chippewa (16.4%, a difference of 0.30%), Marshallese (16.4%, a difference of 0.78%), Black/African American (16.2%, a difference of 0.80%), Osage (16.5%, a difference of 0.91%), and Dutch West Indian (16.1%, a difference of 1.1%).
| Demographics | Rating | Rank | Single Male Poverty |
| Seminole | 0.0 /100 | #311 | Tragic 16.0% |
| Comanche | 0.0 /100 | #312 | Tragic 16.0% |
| Cherokee | 0.0 /100 | #313 | Tragic 16.1% |
| Alaskan Athabascans | 0.0 /100 | #314 | Tragic 16.1% |
| Cheyenne | 0.0 /100 | #315 | Tragic 16.1% |
| Dutch West Indians | 0.0 /100 | #316 | Tragic 16.1% |
| Blacks/African Americans | 0.0 /100 | #317 | Tragic 16.2% |
| Chickasaw | 0.0 /100 | #318 | Tragic 16.3% |
| Chippewa | 0.0 /100 | #319 | Tragic 16.4% |
| Marshallese | 0.0 /100 | #320 | Tragic 16.4% |
| Osage | 0.0 /100 | #321 | Tragic 16.5% |
| Shoshone | 0.0 /100 | #322 | Tragic 16.7% |
| Creek | 0.0 /100 | #323 | Tragic 16.8% |
| Immigrants | Yemen | 0.0 /100 | #324 | Tragic 16.9% |
| Choctaw | 0.0 /100 | #325 | Tragic 17.0% |
Demographics Similar to Samoans by Single Male Poverty
In terms of single male poverty, the demographic groups most similar to Samoans are Bulgarian (11.7%, a difference of 0.10%), Immigrants from Uzbekistan (11.7%, a difference of 0.12%), Cypriot (11.7%, a difference of 0.29%), Paraguayan (11.6%, a difference of 0.31%), and Immigrants from Lithuania (11.6%, a difference of 0.42%).
| Demographics | Rating | Rank | Single Male Poverty |
| Immigrants | Poland | 99.9 /100 | #45 | Exceptional 11.5% |
| Immigrants | Bulgaria | 99.9 /100 | #46 | Exceptional 11.6% |
| Nepalese | 99.9 /100 | #47 | Exceptional 11.6% |
| Immigrants | Indonesia | 99.9 /100 | #48 | Exceptional 11.6% |
| Tlingit-Haida | 99.9 /100 | #49 | Exceptional 11.6% |
| Immigrants | Lithuania | 99.9 /100 | #50 | Exceptional 11.6% |
| Paraguayans | 99.9 /100 | #51 | Exceptional 11.6% |
| Samoans | 99.9 /100 | #52 | Exceptional 11.7% |
| Bulgarians | 99.9 /100 | #53 | Exceptional 11.7% |
| Immigrants | Uzbekistan | 99.9 /100 | #54 | Exceptional 11.7% |
| Cypriots | 99.9 /100 | #55 | Exceptional 11.7% |
| Burmese | 99.8 /100 | #56 | Exceptional 11.7% |
| Immigrants | Romania | 99.8 /100 | #57 | Exceptional 11.7% |
| Immigrants | Brazil | 99.8 /100 | #58 | Exceptional 11.7% |
| Brazilians | 99.8 /100 | #59 | Exceptional 11.8% |