Immigrants from Argentina vs Samoan Single Male Poverty
COMPARE
Immigrants from Argentina
Samoan
Single Male Poverty
Single Male Poverty Comparison
Immigrants from Argentina
Samoans
11.9%
SINGLE MALE POVERTY
99.5/ 100
METRIC RATING
72nd/ 347
METRIC RANK
11.7%
SINGLE MALE POVERTY
99.9/ 100
METRIC RATING
52nd/ 347
METRIC RANK
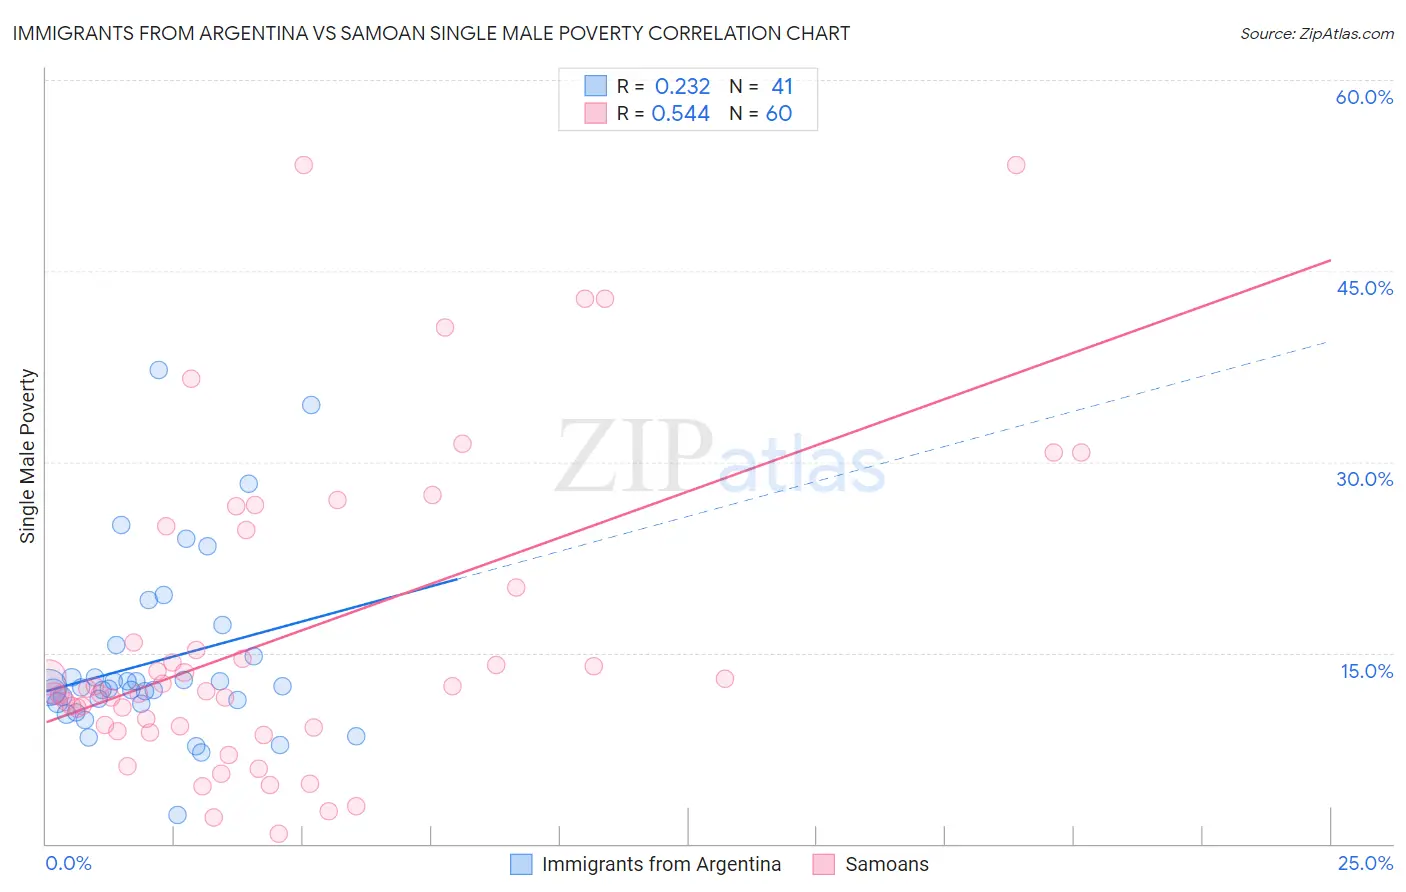
Immigrants from Argentina vs Samoan Single Male Poverty Correlation Chart
The statistical analysis conducted on geographies consisting of 240,377,704 people shows a weak positive correlation between the proportion of Immigrants from Argentina and poverty level among single males in the United States with a correlation coefficient (R) of 0.232 and weighted average of 11.9%. Similarly, the statistical analysis conducted on geographies consisting of 211,659,255 people shows a substantial positive correlation between the proportion of Samoans and poverty level among single males in the United States with a correlation coefficient (R) of 0.544 and weighted average of 11.7%, a difference of 2.1%.
Single Male Poverty Correlation Summary
| Measurement | Immigrants from Argentina | Samoan |
| Minimum | 2.3% | 0.75% |
| Maximum | 37.2% | 53.3% |
| Range | 35.0% | 52.6% |
| Mean | 14.3% | 16.3% |
| Median | 12.3% | 12.1% |
| Interquartile 25% (IQ1) | 11.0% | 9.2% |
| Interquartile 75% (IQ3) | 15.2% | 22.4% |
| Interquartile Range (IQR) | 4.1% | 13.2% |
| Standard Deviation (Sample) | 7.0% | 12.2% |
| Standard Deviation (Population) | 7.0% | 12.1% |
Demographics Similar to Immigrants from Argentina and Samoans by Single Male Poverty
In terms of single male poverty, the demographic groups most similar to Immigrants from Argentina are Immigrants from Greece (11.9%, a difference of 0.18%), Immigrants from Nepal (11.9%, a difference of 0.24%), Immigrants from Russia (11.9%, a difference of 0.26%), Immigrants from Croatia (11.9%, a difference of 0.29%), and Immigrants from Ukraine (11.9%, a difference of 0.30%). Similarly, the demographic groups most similar to Samoans are Bulgarian (11.7%, a difference of 0.10%), Immigrants from Uzbekistan (11.7%, a difference of 0.12%), Cypriot (11.7%, a difference of 0.29%), Burmese (11.7%, a difference of 0.60%), and Immigrants from Romania (11.7%, a difference of 0.76%).
| Demographics | Rating | Rank | Single Male Poverty |
| Samoans | 99.9 /100 | #52 | Exceptional 11.7% |
| Bulgarians | 99.9 /100 | #53 | Exceptional 11.7% |
| Immigrants | Uzbekistan | 99.9 /100 | #54 | Exceptional 11.7% |
| Cypriots | 99.9 /100 | #55 | Exceptional 11.7% |
| Burmese | 99.8 /100 | #56 | Exceptional 11.7% |
| Immigrants | Romania | 99.8 /100 | #57 | Exceptional 11.7% |
| Immigrants | Brazil | 99.8 /100 | #58 | Exceptional 11.7% |
| Brazilians | 99.8 /100 | #59 | Exceptional 11.8% |
| Peruvians | 99.8 /100 | #60 | Exceptional 11.8% |
| Cambodians | 99.8 /100 | #61 | Exceptional 11.8% |
| Immigrants | Sri Lanka | 99.7 /100 | #62 | Exceptional 11.8% |
| Immigrants | Belarus | 99.7 /100 | #63 | Exceptional 11.8% |
| Immigrants | Eastern Europe | 99.6 /100 | #64 | Exceptional 11.8% |
| Laotians | 99.6 /100 | #65 | Exceptional 11.9% |
| Immigrants | Uruguay | 99.6 /100 | #66 | Exceptional 11.9% |
| Immigrants | Ukraine | 99.6 /100 | #67 | Exceptional 11.9% |
| Immigrants | Croatia | 99.6 /100 | #68 | Exceptional 11.9% |
| Immigrants | Russia | 99.6 /100 | #69 | Exceptional 11.9% |
| Immigrants | Nepal | 99.6 /100 | #70 | Exceptional 11.9% |
| Immigrants | Greece | 99.6 /100 | #71 | Exceptional 11.9% |
| Immigrants | Argentina | 99.5 /100 | #72 | Exceptional 11.9% |