Chickasaw vs Immigrants from Portugal Single Male Poverty
COMPARE
Chickasaw
Immigrants from Portugal
Single Male Poverty
Single Male Poverty Comparison
Chickasaw
Immigrants from Portugal
16.3%
SINGLE MALE POVERTY
0.0/ 100
METRIC RATING
318th/ 347
METRIC RANK
12.3%
SINGLE MALE POVERTY
93.6/ 100
METRIC RATING
110th/ 347
METRIC RANK
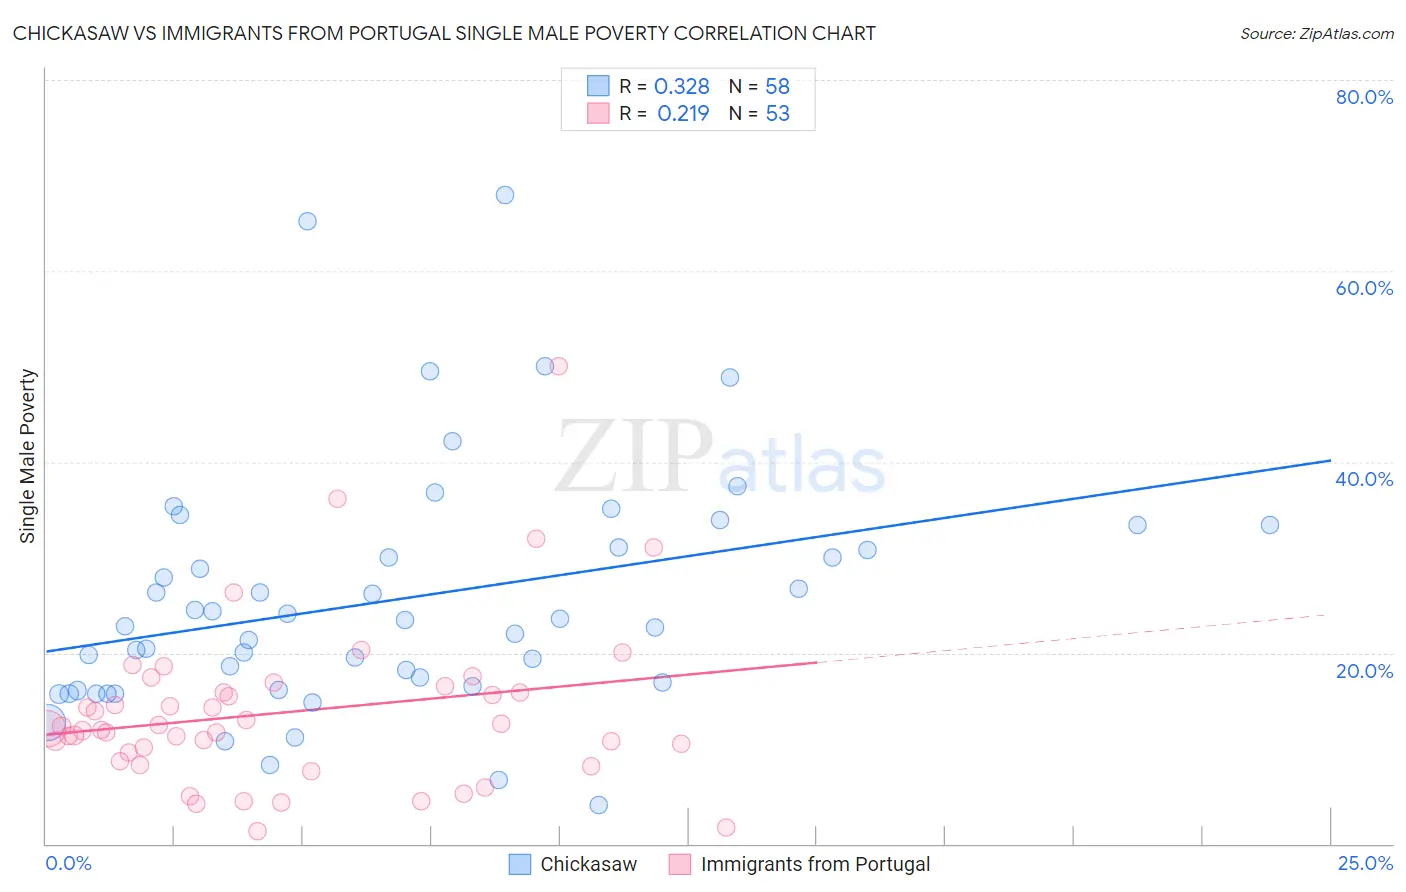
Chickasaw vs Immigrants from Portugal Single Male Poverty Correlation Chart
The statistical analysis conducted on geographies consisting of 140,053,704 people shows a mild positive correlation between the proportion of Chickasaw and poverty level among single males in the United States with a correlation coefficient (R) of 0.328 and weighted average of 16.3%. Similarly, the statistical analysis conducted on geographies consisting of 158,542,705 people shows a weak positive correlation between the proportion of Immigrants from Portugal and poverty level among single males in the United States with a correlation coefficient (R) of 0.219 and weighted average of 12.3%, a difference of 32.2%.
Single Male Poverty Correlation Summary
| Measurement | Chickasaw | Immigrants from Portugal |
| Minimum | 4.0% | 1.3% |
| Maximum | 67.9% | 50.0% |
| Range | 63.9% | 48.7% |
| Mean | 25.6% | 13.8% |
| Median | 23.1% | 12.1% |
| Interquartile 25% (IQ1) | 16.6% | 9.1% |
| Interquartile 75% (IQ3) | 31.0% | 16.2% |
| Interquartile Range (IQR) | 14.5% | 7.1% |
| Standard Deviation (Sample) | 12.7% | 8.7% |
| Standard Deviation (Population) | 12.6% | 8.6% |
Similar Demographics by Single Male Poverty
Demographics Similar to Chickasaw by Single Male Poverty
In terms of single male poverty, the demographic groups most similar to Chickasaw are Chippewa (16.4%, a difference of 0.30%), Marshallese (16.4%, a difference of 0.78%), Black/African American (16.2%, a difference of 0.80%), Osage (16.5%, a difference of 0.91%), and Dutch West Indian (16.1%, a difference of 1.1%).
| Demographics | Rating | Rank | Single Male Poverty |
| Seminole | 0.0 /100 | #311 | Tragic 16.0% |
| Comanche | 0.0 /100 | #312 | Tragic 16.0% |
| Cherokee | 0.0 /100 | #313 | Tragic 16.1% |
| Alaskan Athabascans | 0.0 /100 | #314 | Tragic 16.1% |
| Cheyenne | 0.0 /100 | #315 | Tragic 16.1% |
| Dutch West Indians | 0.0 /100 | #316 | Tragic 16.1% |
| Blacks/African Americans | 0.0 /100 | #317 | Tragic 16.2% |
| Chickasaw | 0.0 /100 | #318 | Tragic 16.3% |
| Chippewa | 0.0 /100 | #319 | Tragic 16.4% |
| Marshallese | 0.0 /100 | #320 | Tragic 16.4% |
| Osage | 0.0 /100 | #321 | Tragic 16.5% |
| Shoshone | 0.0 /100 | #322 | Tragic 16.7% |
| Creek | 0.0 /100 | #323 | Tragic 16.8% |
| Immigrants | Yemen | 0.0 /100 | #324 | Tragic 16.9% |
| Choctaw | 0.0 /100 | #325 | Tragic 17.0% |
Demographics Similar to Immigrants from Portugal by Single Male Poverty
In terms of single male poverty, the demographic groups most similar to Immigrants from Portugal are Immigrants from North Macedonia (12.3%, a difference of 0.010%), Kenyan (12.4%, a difference of 0.070%), Ugandan (12.3%, a difference of 0.23%), Pakistani (12.4%, a difference of 0.26%), and Nicaraguan (12.4%, a difference of 0.30%).
| Demographics | Rating | Rank | Single Male Poverty |
| Immigrants | Armenia | 96.7 /100 | #103 | Exceptional 12.2% |
| Immigrants | Kazakhstan | 96.7 /100 | #104 | Exceptional 12.2% |
| Jordanians | 95.9 /100 | #105 | Exceptional 12.3% |
| Immigrants | Morocco | 95.6 /100 | #106 | Exceptional 12.3% |
| Iraqis | 95.1 /100 | #107 | Exceptional 12.3% |
| Immigrants | Eastern Africa | 95.0 /100 | #108 | Exceptional 12.3% |
| Ugandans | 94.5 /100 | #109 | Exceptional 12.3% |
| Immigrants | Portugal | 93.6 /100 | #110 | Exceptional 12.3% |
| Immigrants | North Macedonia | 93.6 /100 | #111 | Exceptional 12.3% |
| Kenyans | 93.3 /100 | #112 | Exceptional 12.4% |
| Pakistanis | 92.4 /100 | #113 | Exceptional 12.4% |
| Nicaraguans | 92.1 /100 | #114 | Exceptional 12.4% |
| Immigrants | Southern Europe | 91.5 /100 | #115 | Exceptional 12.4% |
| Immigrants | Syria | 91.2 /100 | #116 | Exceptional 12.4% |
| Immigrants | Oceania | 91.1 /100 | #117 | Exceptional 12.4% |