Chickasaw vs Israeli Single Male Poverty
COMPARE
Chickasaw
Israeli
Single Male Poverty
Single Male Poverty Comparison
Chickasaw
Israelis
16.3%
SINGLE MALE POVERTY
0.0/ 100
METRIC RATING
318th/ 347
METRIC RANK
12.9%
SINGLE MALE POVERTY
41.0/ 100
METRIC RATING
179th/ 347
METRIC RANK
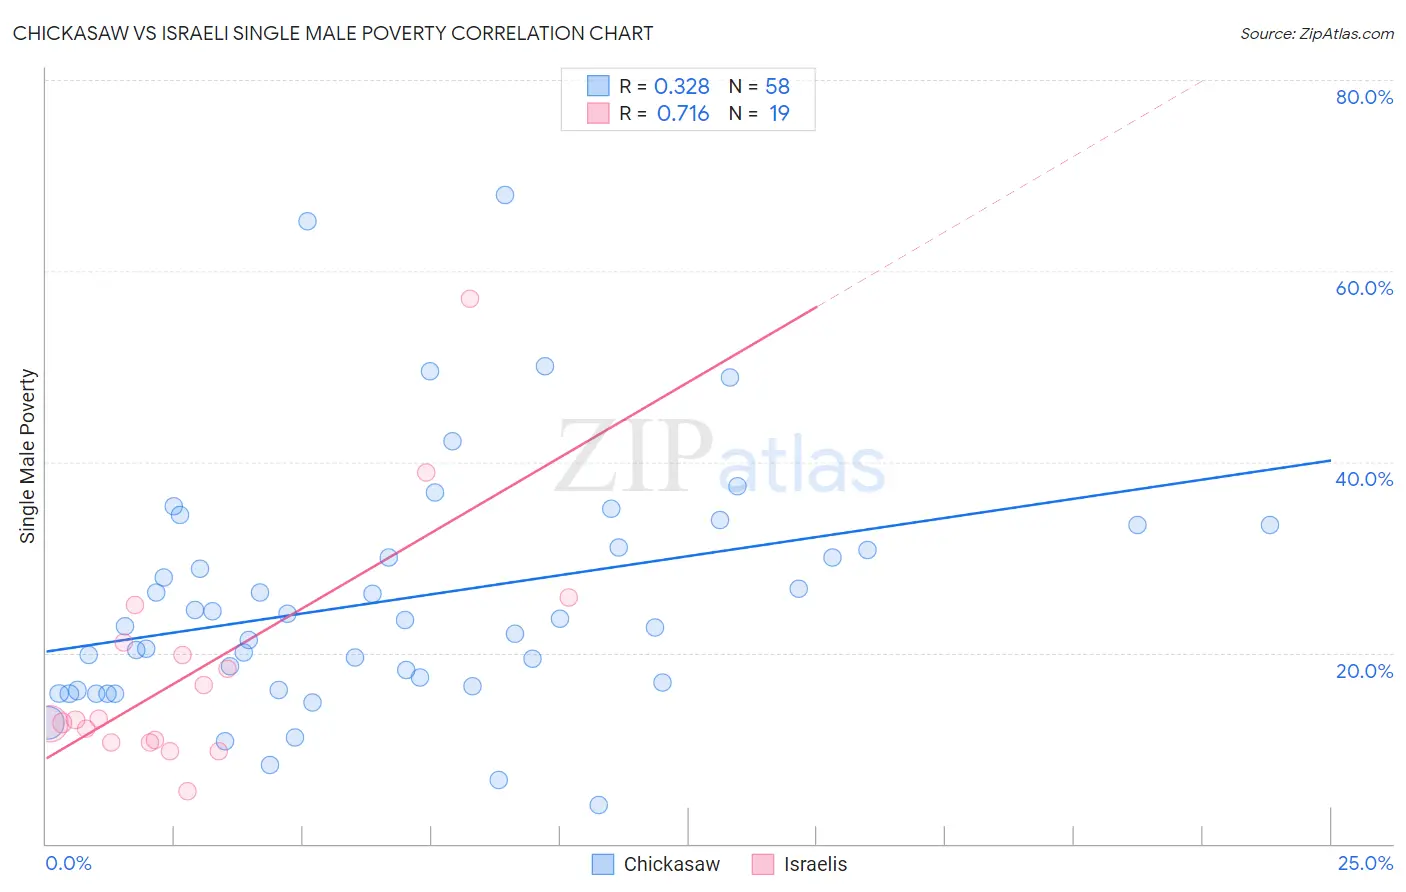
Chickasaw vs Israeli Single Male Poverty Correlation Chart
The statistical analysis conducted on geographies consisting of 140,053,704 people shows a mild positive correlation between the proportion of Chickasaw and poverty level among single males in the United States with a correlation coefficient (R) of 0.328 and weighted average of 16.3%. Similarly, the statistical analysis conducted on geographies consisting of 193,355,053 people shows a strong positive correlation between the proportion of Israelis and poverty level among single males in the United States with a correlation coefficient (R) of 0.716 and weighted average of 12.9%, a difference of 26.9%.
Single Male Poverty Correlation Summary
| Measurement | Chickasaw | Israeli |
| Minimum | 4.0% | 5.5% |
| Maximum | 67.9% | 57.1% |
| Range | 63.9% | 51.7% |
| Mean | 25.6% | 18.0% |
| Median | 23.1% | 13.0% |
| Interquartile 25% (IQ1) | 16.6% | 10.6% |
| Interquartile 75% (IQ3) | 31.0% | 21.1% |
| Interquartile Range (IQR) | 14.5% | 10.5% |
| Standard Deviation (Sample) | 12.7% | 12.2% |
| Standard Deviation (Population) | 12.6% | 11.9% |
Similar Demographics by Single Male Poverty
Demographics Similar to Chickasaw by Single Male Poverty
In terms of single male poverty, the demographic groups most similar to Chickasaw are Chippewa (16.4%, a difference of 0.30%), Marshallese (16.4%, a difference of 0.78%), Black/African American (16.2%, a difference of 0.80%), Osage (16.5%, a difference of 0.91%), and Dutch West Indian (16.1%, a difference of 1.1%).
| Demographics | Rating | Rank | Single Male Poverty |
| Seminole | 0.0 /100 | #311 | Tragic 16.0% |
| Comanche | 0.0 /100 | #312 | Tragic 16.0% |
| Cherokee | 0.0 /100 | #313 | Tragic 16.1% |
| Alaskan Athabascans | 0.0 /100 | #314 | Tragic 16.1% |
| Cheyenne | 0.0 /100 | #315 | Tragic 16.1% |
| Dutch West Indians | 0.0 /100 | #316 | Tragic 16.1% |
| Blacks/African Americans | 0.0 /100 | #317 | Tragic 16.2% |
| Chickasaw | 0.0 /100 | #318 | Tragic 16.3% |
| Chippewa | 0.0 /100 | #319 | Tragic 16.4% |
| Marshallese | 0.0 /100 | #320 | Tragic 16.4% |
| Osage | 0.0 /100 | #321 | Tragic 16.5% |
| Shoshone | 0.0 /100 | #322 | Tragic 16.7% |
| Creek | 0.0 /100 | #323 | Tragic 16.8% |
| Immigrants | Yemen | 0.0 /100 | #324 | Tragic 16.9% |
| Choctaw | 0.0 /100 | #325 | Tragic 17.0% |
Demographics Similar to Israelis by Single Male Poverty
In terms of single male poverty, the demographic groups most similar to Israelis are Immigrants from Switzerland (12.8%, a difference of 0.11%), Immigrants from North America (12.9%, a difference of 0.18%), Panamanian (12.9%, a difference of 0.19%), Immigrants from Canada (12.8%, a difference of 0.20%), and Moroccan (12.9%, a difference of 0.23%).
| Demographics | Rating | Rank | Single Male Poverty |
| Danes | 51.4 /100 | #172 | Average 12.8% |
| Immigrants | St. Vincent and the Grenadines | 50.9 /100 | #173 | Average 12.8% |
| Costa Ricans | 50.0 /100 | #174 | Average 12.8% |
| Croatians | 48.9 /100 | #175 | Average 12.8% |
| Syrians | 48.4 /100 | #176 | Average 12.8% |
| Immigrants | Canada | 44.8 /100 | #177 | Average 12.8% |
| Immigrants | Switzerland | 43.1 /100 | #178 | Average 12.8% |
| Israelis | 41.0 /100 | #179 | Average 12.9% |
| Immigrants | North America | 37.7 /100 | #180 | Fair 12.9% |
| Panamanians | 37.6 /100 | #181 | Fair 12.9% |
| Moroccans | 36.8 /100 | #182 | Fair 12.9% |
| Immigrants | West Indies | 33.0 /100 | #183 | Fair 12.9% |
| Immigrants | Trinidad and Tobago | 32.5 /100 | #184 | Fair 12.9% |
| Norwegians | 32.0 /100 | #185 | Fair 12.9% |
| Nigerians | 31.9 /100 | #186 | Fair 12.9% |