Chickasaw vs Immigrants from Uganda Single Male Poverty
COMPARE
Chickasaw
Immigrants from Uganda
Single Male Poverty
Single Male Poverty Comparison
Chickasaw
Immigrants from Uganda
16.3%
SINGLE MALE POVERTY
0.0/ 100
METRIC RATING
318th/ 347
METRIC RANK
12.6%
SINGLE MALE POVERTY
75.9/ 100
METRIC RATING
142nd/ 347
METRIC RANK
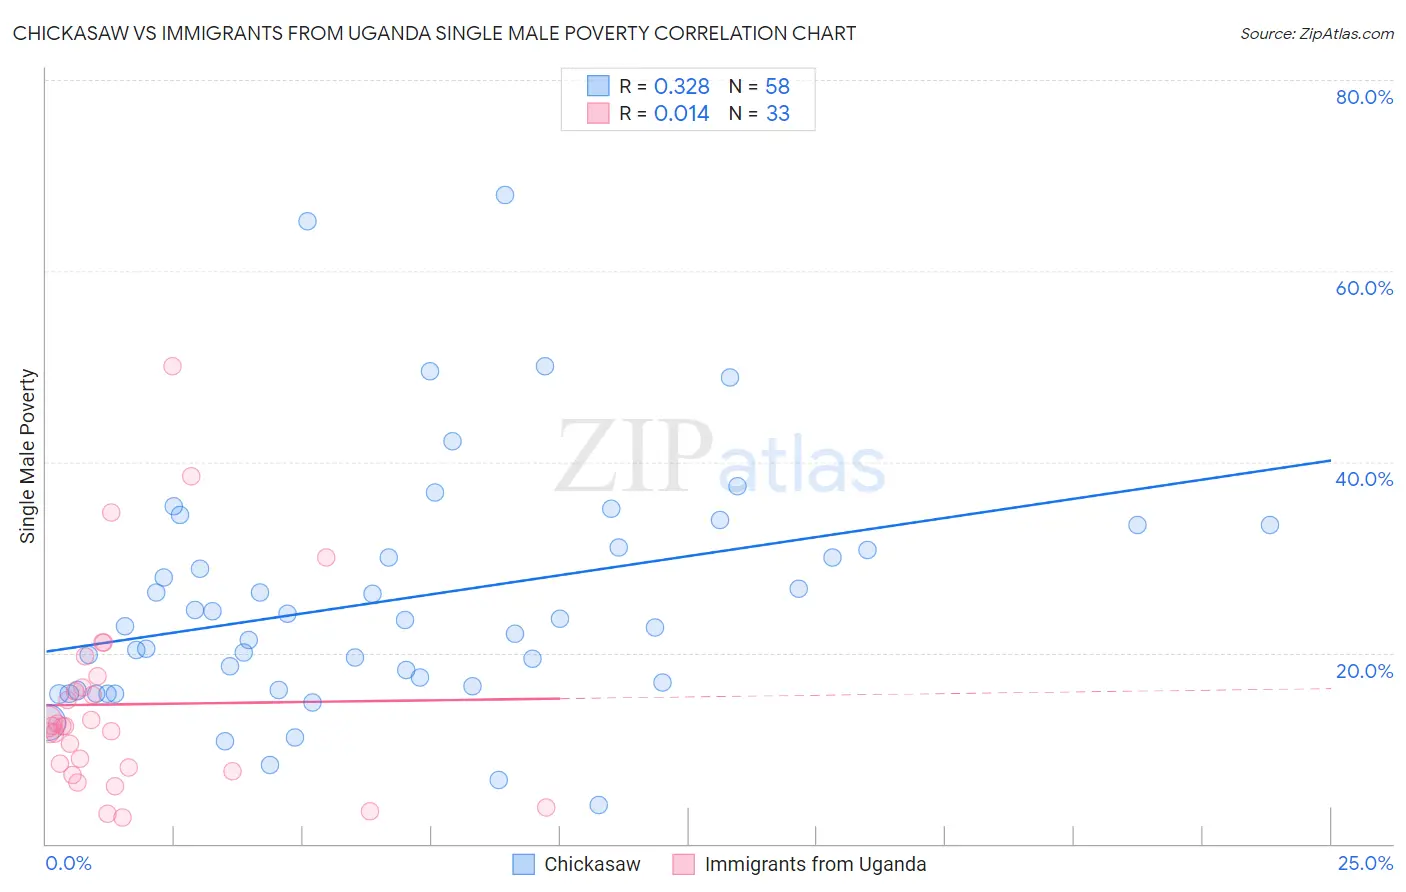
Chickasaw vs Immigrants from Uganda Single Male Poverty Correlation Chart
The statistical analysis conducted on geographies consisting of 140,053,704 people shows a mild positive correlation between the proportion of Chickasaw and poverty level among single males in the United States with a correlation coefficient (R) of 0.328 and weighted average of 16.3%. Similarly, the statistical analysis conducted on geographies consisting of 119,797,773 people shows no correlation between the proportion of Immigrants from Uganda and poverty level among single males in the United States with a correlation coefficient (R) of 0.014 and weighted average of 12.6%, a difference of 29.4%.
Single Male Poverty Correlation Summary
| Measurement | Chickasaw | Immigrants from Uganda |
| Minimum | 4.0% | 2.7% |
| Maximum | 67.9% | 50.0% |
| Range | 63.9% | 47.3% |
| Mean | 25.6% | 14.6% |
| Median | 23.1% | 12.4% |
| Interquartile 25% (IQ1) | 16.6% | 7.8% |
| Interquartile 75% (IQ3) | 31.0% | 17.0% |
| Interquartile Range (IQR) | 14.5% | 9.1% |
| Standard Deviation (Sample) | 12.7% | 10.5% |
| Standard Deviation (Population) | 12.6% | 10.3% |
Similar Demographics by Single Male Poverty
Demographics Similar to Chickasaw by Single Male Poverty
In terms of single male poverty, the demographic groups most similar to Chickasaw are Chippewa (16.4%, a difference of 0.30%), Marshallese (16.4%, a difference of 0.78%), Black/African American (16.2%, a difference of 0.80%), Osage (16.5%, a difference of 0.91%), and Dutch West Indian (16.1%, a difference of 1.1%).
| Demographics | Rating | Rank | Single Male Poverty |
| Seminole | 0.0 /100 | #311 | Tragic 16.0% |
| Comanche | 0.0 /100 | #312 | Tragic 16.0% |
| Cherokee | 0.0 /100 | #313 | Tragic 16.1% |
| Alaskan Athabascans | 0.0 /100 | #314 | Tragic 16.1% |
| Cheyenne | 0.0 /100 | #315 | Tragic 16.1% |
| Dutch West Indians | 0.0 /100 | #316 | Tragic 16.1% |
| Blacks/African Americans | 0.0 /100 | #317 | Tragic 16.2% |
| Chickasaw | 0.0 /100 | #318 | Tragic 16.3% |
| Chippewa | 0.0 /100 | #319 | Tragic 16.4% |
| Marshallese | 0.0 /100 | #320 | Tragic 16.4% |
| Osage | 0.0 /100 | #321 | Tragic 16.5% |
| Shoshone | 0.0 /100 | #322 | Tragic 16.7% |
| Creek | 0.0 /100 | #323 | Tragic 16.8% |
| Immigrants | Yemen | 0.0 /100 | #324 | Tragic 16.9% |
| Choctaw | 0.0 /100 | #325 | Tragic 17.0% |
Demographics Similar to Immigrants from Uganda by Single Male Poverty
In terms of single male poverty, the demographic groups most similar to Immigrants from Uganda are Okinawan (12.6%, a difference of 0.0%), Immigrants from France (12.6%, a difference of 0.010%), Hawaiian (12.6%, a difference of 0.060%), Immigrants from Lebanon (12.6%, a difference of 0.070%), and Native Hawaiian (12.6%, a difference of 0.070%).
| Demographics | Rating | Rank | Single Male Poverty |
| Immigrants | Costa Rica | 81.9 /100 | #135 | Excellent 12.5% |
| Immigrants | Austria | 81.9 /100 | #136 | Excellent 12.5% |
| Ukrainians | 80.7 /100 | #137 | Excellent 12.6% |
| Immigrants | El Salvador | 80.0 /100 | #138 | Excellent 12.6% |
| Cubans | 79.9 /100 | #139 | Good 12.6% |
| Immigrants | Zimbabwe | 78.0 /100 | #140 | Good 12.6% |
| Okinawans | 75.9 /100 | #141 | Good 12.6% |
| Immigrants | Uganda | 75.9 /100 | #142 | Good 12.6% |
| Immigrants | France | 75.8 /100 | #143 | Good 12.6% |
| Hawaiians | 75.1 /100 | #144 | Good 12.6% |
| Immigrants | Lebanon | 75.0 /100 | #145 | Good 12.6% |
| Native Hawaiians | 75.0 /100 | #146 | Good 12.6% |
| Malaysians | 74.8 /100 | #147 | Good 12.6% |
| Yugoslavians | 73.9 /100 | #148 | Good 12.6% |
| Sierra Leoneans | 73.0 /100 | #149 | Good 12.6% |