Chickasaw vs Immigrants from Nepal Single Male Poverty
COMPARE
Chickasaw
Immigrants from Nepal
Single Male Poverty
Single Male Poverty Comparison
Chickasaw
Immigrants from Nepal
16.3%
SINGLE MALE POVERTY
0.0/ 100
METRIC RATING
318th/ 347
METRIC RANK
11.9%
SINGLE MALE POVERTY
99.6/ 100
METRIC RATING
70th/ 347
METRIC RANK
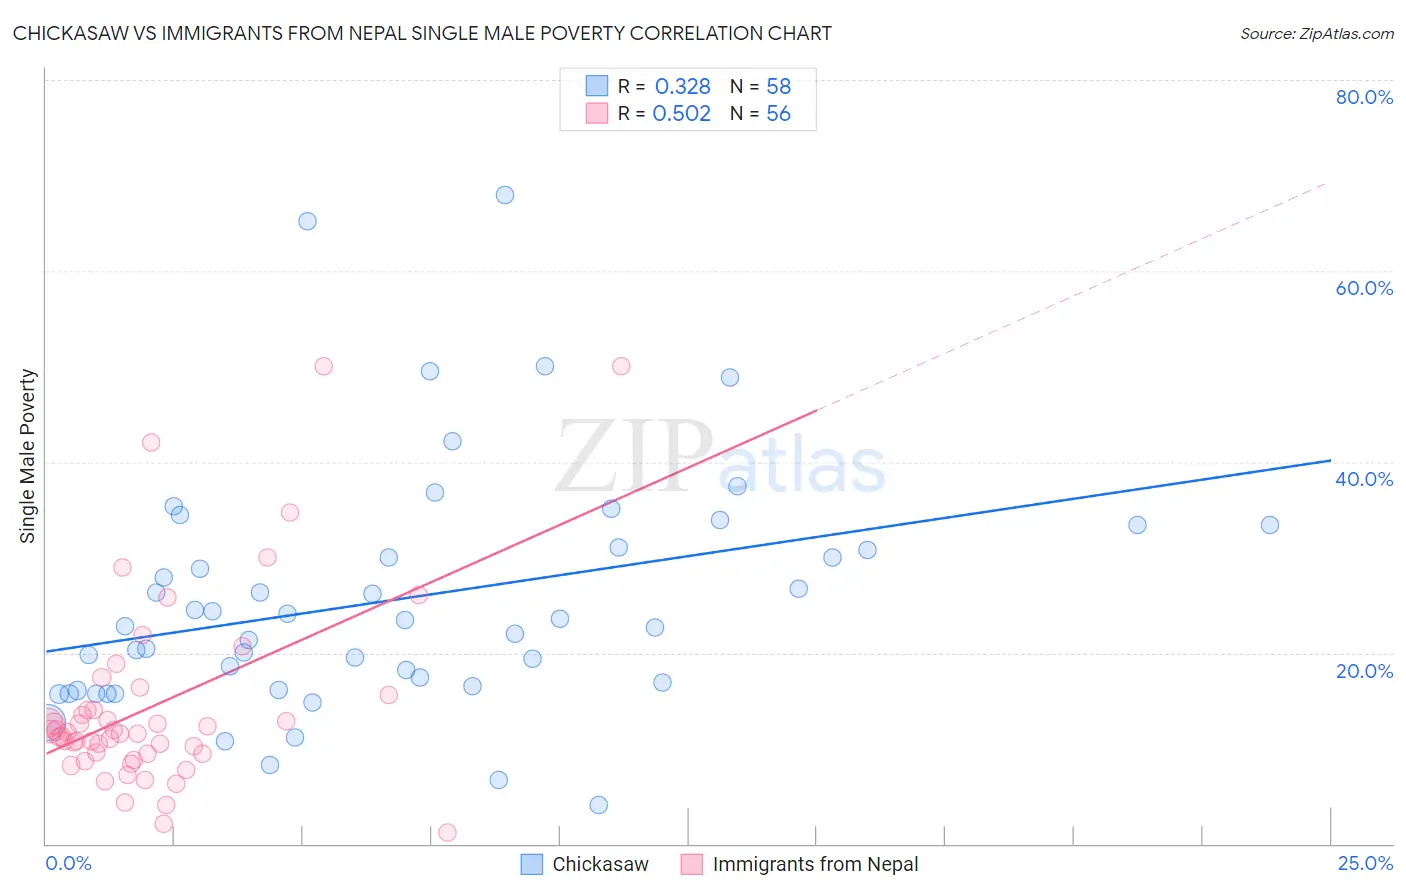
Chickasaw vs Immigrants from Nepal Single Male Poverty Correlation Chart
The statistical analysis conducted on geographies consisting of 140,053,704 people shows a mild positive correlation between the proportion of Chickasaw and poverty level among single males in the United States with a correlation coefficient (R) of 0.328 and weighted average of 16.3%. Similarly, the statistical analysis conducted on geographies consisting of 173,608,756 people shows a substantial positive correlation between the proportion of Immigrants from Nepal and poverty level among single males in the United States with a correlation coefficient (R) of 0.502 and weighted average of 11.9%, a difference of 37.5%.
Single Male Poverty Correlation Summary
| Measurement | Chickasaw | Immigrants from Nepal |
| Minimum | 4.0% | 1.2% |
| Maximum | 67.9% | 50.0% |
| Range | 63.9% | 48.8% |
| Mean | 25.6% | 14.6% |
| Median | 23.1% | 11.6% |
| Interquartile 25% (IQ1) | 16.6% | 9.4% |
| Interquartile 75% (IQ3) | 31.0% | 14.8% |
| Interquartile Range (IQR) | 14.5% | 5.4% |
| Standard Deviation (Sample) | 12.7% | 10.3% |
| Standard Deviation (Population) | 12.6% | 10.2% |
Similar Demographics by Single Male Poverty
Demographics Similar to Chickasaw by Single Male Poverty
In terms of single male poverty, the demographic groups most similar to Chickasaw are Chippewa (16.4%, a difference of 0.30%), Marshallese (16.4%, a difference of 0.78%), Black/African American (16.2%, a difference of 0.80%), Osage (16.5%, a difference of 0.91%), and Dutch West Indian (16.1%, a difference of 1.1%).
| Demographics | Rating | Rank | Single Male Poverty |
| Seminole | 0.0 /100 | #311 | Tragic 16.0% |
| Comanche | 0.0 /100 | #312 | Tragic 16.0% |
| Cherokee | 0.0 /100 | #313 | Tragic 16.1% |
| Alaskan Athabascans | 0.0 /100 | #314 | Tragic 16.1% |
| Cheyenne | 0.0 /100 | #315 | Tragic 16.1% |
| Dutch West Indians | 0.0 /100 | #316 | Tragic 16.1% |
| Blacks/African Americans | 0.0 /100 | #317 | Tragic 16.2% |
| Chickasaw | 0.0 /100 | #318 | Tragic 16.3% |
| Chippewa | 0.0 /100 | #319 | Tragic 16.4% |
| Marshallese | 0.0 /100 | #320 | Tragic 16.4% |
| Osage | 0.0 /100 | #321 | Tragic 16.5% |
| Shoshone | 0.0 /100 | #322 | Tragic 16.7% |
| Creek | 0.0 /100 | #323 | Tragic 16.8% |
| Immigrants | Yemen | 0.0 /100 | #324 | Tragic 16.9% |
| Choctaw | 0.0 /100 | #325 | Tragic 17.0% |
Demographics Similar to Immigrants from Nepal by Single Male Poverty
In terms of single male poverty, the demographic groups most similar to Immigrants from Nepal are Immigrants from Russia (11.9%, a difference of 0.020%), Immigrants from Croatia (11.9%, a difference of 0.040%), Immigrants from Ukraine (11.9%, a difference of 0.060%), Immigrants from Greece (11.9%, a difference of 0.060%), and Laotian (11.9%, a difference of 0.080%).
| Demographics | Rating | Rank | Single Male Poverty |
| Immigrants | Belarus | 99.7 /100 | #63 | Exceptional 11.8% |
| Immigrants | Eastern Europe | 99.6 /100 | #64 | Exceptional 11.8% |
| Laotians | 99.6 /100 | #65 | Exceptional 11.9% |
| Immigrants | Uruguay | 99.6 /100 | #66 | Exceptional 11.9% |
| Immigrants | Ukraine | 99.6 /100 | #67 | Exceptional 11.9% |
| Immigrants | Croatia | 99.6 /100 | #68 | Exceptional 11.9% |
| Immigrants | Russia | 99.6 /100 | #69 | Exceptional 11.9% |
| Immigrants | Nepal | 99.6 /100 | #70 | Exceptional 11.9% |
| Immigrants | Greece | 99.6 /100 | #71 | Exceptional 11.9% |
| Immigrants | Argentina | 99.5 /100 | #72 | Exceptional 11.9% |
| Argentineans | 99.5 /100 | #73 | Exceptional 11.9% |
| Chileans | 99.5 /100 | #74 | Exceptional 11.9% |
| Uruguayans | 99.4 /100 | #75 | Exceptional 11.9% |
| Immigrants | Northern Africa | 99.4 /100 | #76 | Exceptional 11.9% |
| Immigrants | Malaysia | 99.2 /100 | #77 | Exceptional 12.0% |