Chickasaw vs Samoan In Labor Force | Age 45-54
COMPARE
Chickasaw
Samoan
In Labor Force | Age 45-54
In Labor Force | Age 45-54 Comparison
Chickasaw
Samoans
79.0%
IN LABOR FORCE | AGE 45-54
0.0/ 100
METRIC RATING
318th/ 347
METRIC RANK
81.8%
IN LABOR FORCE | AGE 45-54
0.6/ 100
METRIC RATING
243rd/ 347
METRIC RANK
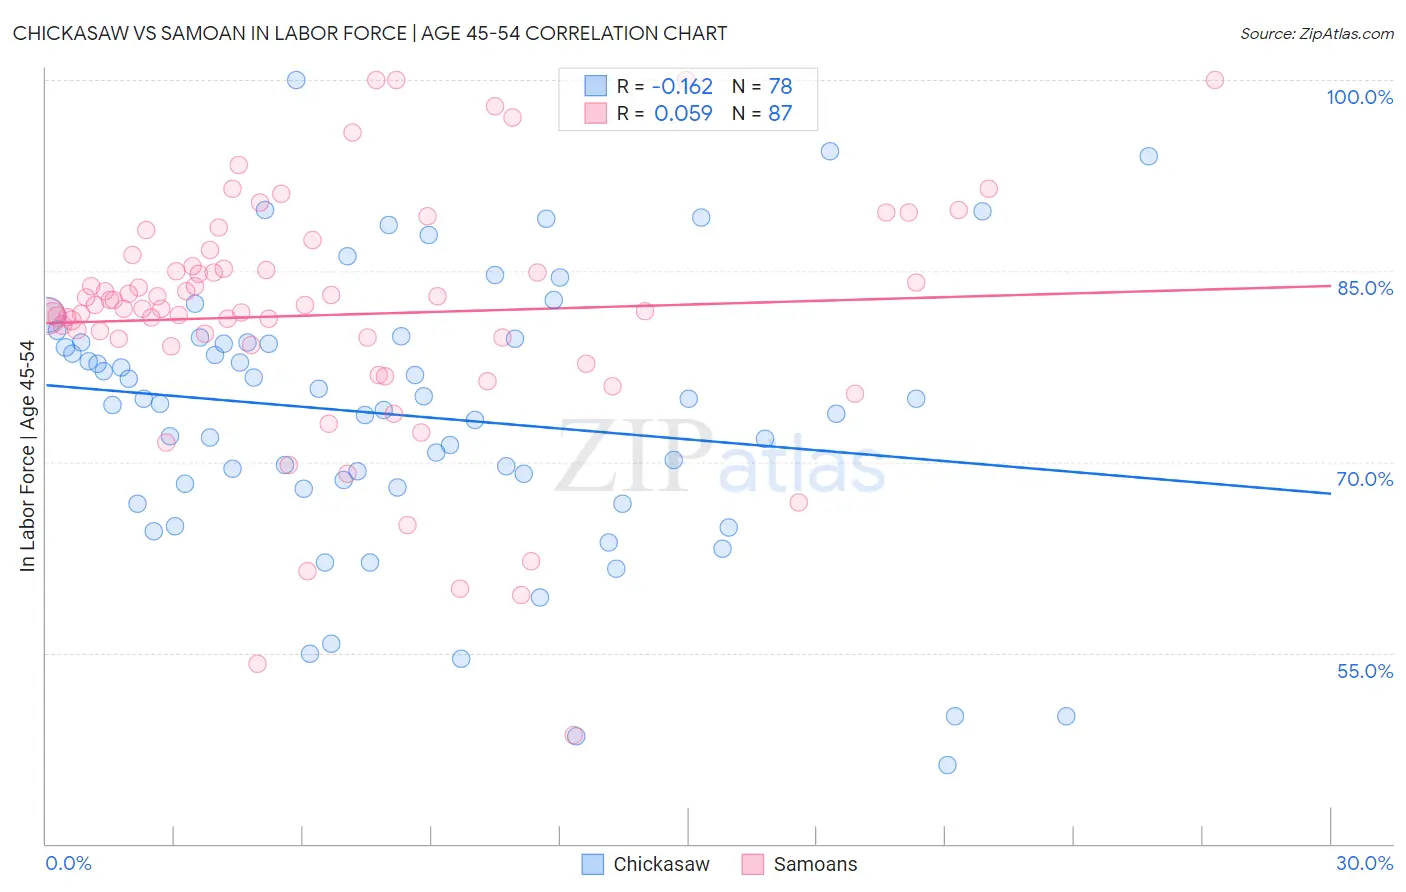
Chickasaw vs Samoan In Labor Force | Age 45-54 Correlation Chart
The statistical analysis conducted on geographies consisting of 147,675,622 people shows a poor negative correlation between the proportion of Chickasaw and labor force participation rate among population between the ages 45 and 54 in the United States with a correlation coefficient (R) of -0.162 and weighted average of 79.0%. Similarly, the statistical analysis conducted on geographies consisting of 225,090,886 people shows a slight positive correlation between the proportion of Samoans and labor force participation rate among population between the ages 45 and 54 in the United States with a correlation coefficient (R) of 0.059 and weighted average of 81.8%, a difference of 3.5%.
In Labor Force | Age 45-54 Correlation Summary
| Measurement | Chickasaw | Samoan |
| Minimum | 46.2% | 48.5% |
| Maximum | 100.0% | 100.0% |
| Range | 53.8% | 51.5% |
| Mean | 73.6% | 81.6% |
| Median | 74.8% | 82.1% |
| Interquartile 25% (IQ1) | 68.0% | 79.2% |
| Interquartile 75% (IQ3) | 79.4% | 85.4% |
| Interquartile Range (IQR) | 11.4% | 6.1% |
| Standard Deviation (Sample) | 10.8% | 9.7% |
| Standard Deviation (Population) | 10.7% | 9.6% |
Similar Demographics by In Labor Force | Age 45-54
Demographics Similar to Chickasaw by In Labor Force | Age 45-54
In terms of in labor force | age 45-54, the demographic groups most similar to Chickasaw are Cherokee (79.0%, a difference of 0.10%), Comanche (79.2%, a difference of 0.17%), Yaqui (78.9%, a difference of 0.21%), Shoshone (79.3%, a difference of 0.31%), and Black/African American (79.3%, a difference of 0.39%).
| Demographics | Rating | Rank | In Labor Force | Age 45-54 |
| Mexicans | 0.0 /100 | #311 | Tragic 79.8% |
| Immigrants | Mexico | 0.0 /100 | #312 | Tragic 79.7% |
| Colville | 0.0 /100 | #313 | Tragic 79.5% |
| Ottawa | 0.0 /100 | #314 | Tragic 79.5% |
| Blacks/African Americans | 0.0 /100 | #315 | Tragic 79.3% |
| Shoshone | 0.0 /100 | #316 | Tragic 79.3% |
| Comanche | 0.0 /100 | #317 | Tragic 79.2% |
| Chickasaw | 0.0 /100 | #318 | Tragic 79.0% |
| Cherokee | 0.0 /100 | #319 | Tragic 79.0% |
| Yaqui | 0.0 /100 | #320 | Tragic 78.9% |
| Yup'ik | 0.0 /100 | #321 | Tragic 78.6% |
| Crow | 0.0 /100 | #322 | Tragic 78.3% |
| Kiowa | 0.0 /100 | #323 | Tragic 78.3% |
| Dutch West Indians | 0.0 /100 | #324 | Tragic 78.2% |
| Choctaw | 0.0 /100 | #325 | Tragic 78.2% |
Demographics Similar to Samoans by In Labor Force | Age 45-54
In terms of in labor force | age 45-54, the demographic groups most similar to Samoans are White/Caucasian (81.9%, a difference of 0.010%), Immigrants from Cambodia (81.9%, a difference of 0.050%), Immigrants from El Salvador (81.9%, a difference of 0.090%), Celtic (81.8%, a difference of 0.090%), and Immigrants from Thailand (81.9%, a difference of 0.10%).
| Demographics | Rating | Rank | In Labor Force | Age 45-54 |
| Basques | 1.2 /100 | #236 | Tragic 82.0% |
| Immigrants | Trinidad and Tobago | 1.2 /100 | #237 | Tragic 82.0% |
| Trinidadians and Tobagonians | 1.1 /100 | #238 | Tragic 81.9% |
| Immigrants | Thailand | 1.0 /100 | #239 | Tragic 81.9% |
| Immigrants | El Salvador | 1.0 /100 | #240 | Tragic 81.9% |
| Immigrants | Cambodia | 0.8 /100 | #241 | Tragic 81.9% |
| Whites/Caucasians | 0.7 /100 | #242 | Tragic 81.9% |
| Samoans | 0.6 /100 | #243 | Tragic 81.8% |
| Celtics | 0.4 /100 | #244 | Tragic 81.8% |
| Alaska Natives | 0.4 /100 | #245 | Tragic 81.8% |
| Alaskan Athabascans | 0.4 /100 | #246 | Tragic 81.8% |
| Central Americans | 0.4 /100 | #247 | Tragic 81.7% |
| Puget Sound Salish | 0.3 /100 | #248 | Tragic 81.7% |
| Hmong | 0.3 /100 | #249 | Tragic 81.7% |
| Immigrants | Armenia | 0.2 /100 | #250 | Tragic 81.7% |