Chickasaw vs Immigrants from Uganda Hearing Disability
COMPARE
Chickasaw
Immigrants from Uganda
Hearing Disability
Hearing Disability Comparison
Chickasaw
Immigrants from Uganda
4.5%
HEARING DISABILITY
0.0/ 100
METRIC RATING
337th/ 347
METRIC RANK
2.9%
HEARING DISABILITY
86.6/ 100
METRIC RATING
129th/ 347
METRIC RANK
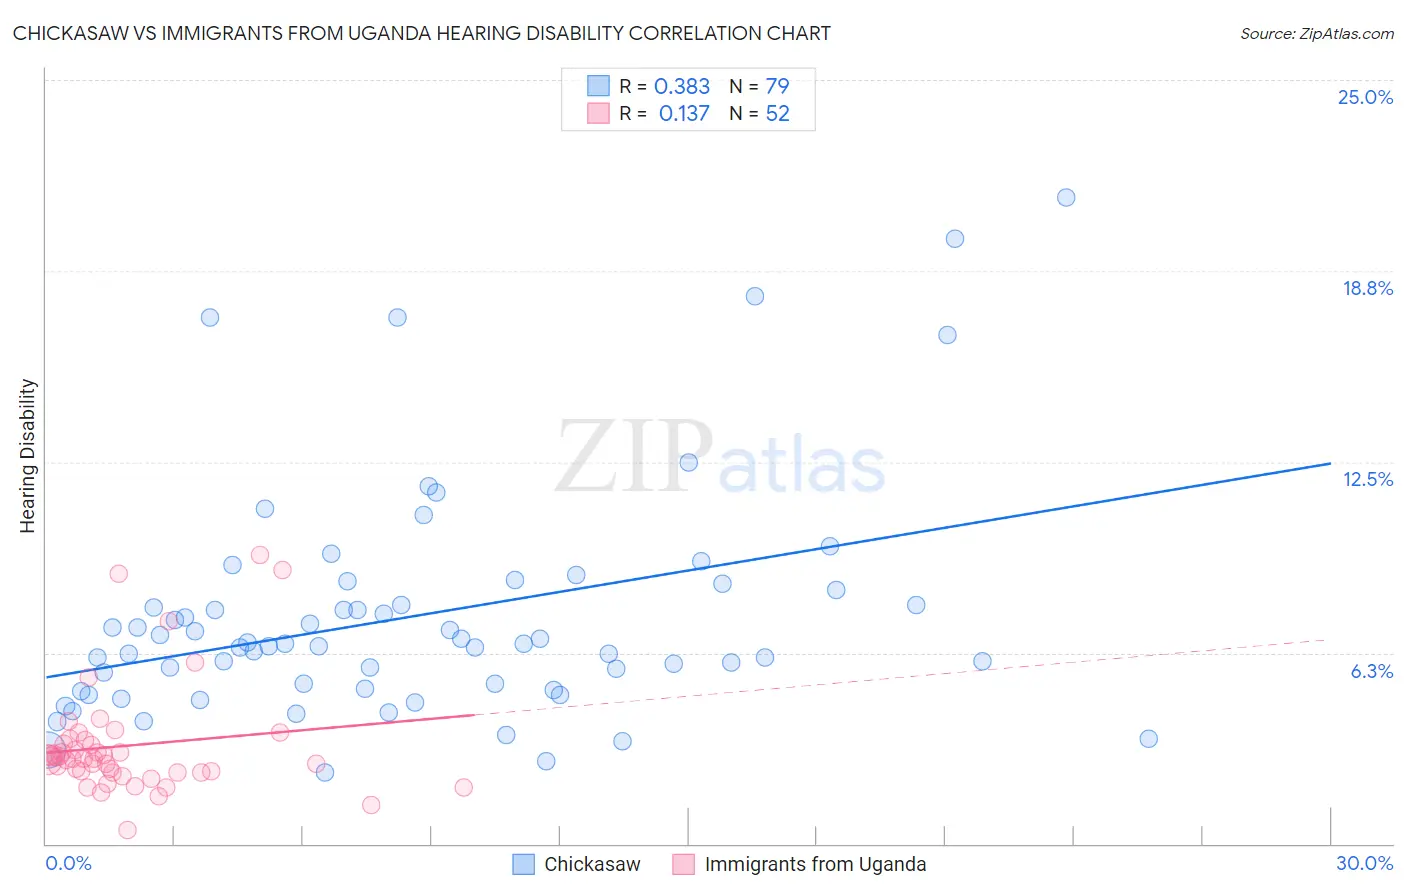
Chickasaw vs Immigrants from Uganda Hearing Disability Correlation Chart
The statistical analysis conducted on geographies consisting of 147,680,195 people shows a mild positive correlation between the proportion of Chickasaw and percentage of population with hearing disability in the United States with a correlation coefficient (R) of 0.383 and weighted average of 4.5%. Similarly, the statistical analysis conducted on geographies consisting of 125,979,149 people shows a poor positive correlation between the proportion of Immigrants from Uganda and percentage of population with hearing disability in the United States with a correlation coefficient (R) of 0.137 and weighted average of 2.9%, a difference of 56.3%.
Hearing Disability Correlation Summary
| Measurement | Chickasaw | Immigrants from Uganda |
| Minimum | 2.3% | 0.45% |
| Maximum | 21.2% | 9.4% |
| Range | 18.8% | 9.0% |
| Mean | 7.4% | 3.2% |
| Median | 6.5% | 2.8% |
| Interquartile 25% (IQ1) | 5.1% | 2.4% |
| Interquartile 75% (IQ3) | 8.3% | 3.3% |
| Interquartile Range (IQR) | 3.2% | 0.98% |
| Standard Deviation (Sample) | 3.8% | 1.8% |
| Standard Deviation (Population) | 3.8% | 1.8% |
Similar Demographics by Hearing Disability
Demographics Similar to Chickasaw by Hearing Disability
In terms of hearing disability, the demographic groups most similar to Chickasaw are Alaska Native (4.5%, a difference of 0.21%), Choctaw (4.5%, a difference of 1.6%), Creek (4.4%, a difference of 2.5%), Pueblo (4.6%, a difference of 3.2%), and Kiowa (4.3%, a difference of 3.2%).
| Demographics | Rating | Rank | Hearing Disability |
| Natives/Alaskans | 0.0 /100 | #330 | Tragic 4.2% |
| Cherokee | 0.0 /100 | #331 | Tragic 4.2% |
| Houma | 0.0 /100 | #332 | Tragic 4.2% |
| Dutch West Indians | 0.0 /100 | #333 | Tragic 4.3% |
| Aleuts | 0.0 /100 | #334 | Tragic 4.3% |
| Kiowa | 0.0 /100 | #335 | Tragic 4.3% |
| Creek | 0.0 /100 | #336 | Tragic 4.4% |
| Chickasaw | 0.0 /100 | #337 | Tragic 4.5% |
| Alaska Natives | 0.0 /100 | #338 | Tragic 4.5% |
| Choctaw | 0.0 /100 | #339 | Tragic 4.5% |
| Pueblo | 0.0 /100 | #340 | Tragic 4.6% |
| Navajo | 0.0 /100 | #341 | Tragic 4.6% |
| Tsimshian | 0.0 /100 | #342 | Tragic 4.7% |
| Inupiat | 0.0 /100 | #343 | Tragic 4.7% |
| Tlingit-Haida | 0.0 /100 | #344 | Tragic 4.8% |
Demographics Similar to Immigrants from Uganda by Hearing Disability
In terms of hearing disability, the demographic groups most similar to Immigrants from Uganda are Immigrants from Vietnam (2.9%, a difference of 0.020%), South American Indian (2.9%, a difference of 0.050%), Immigrants from Western Asia (2.9%, a difference of 0.050%), Immigrants from Kenya (2.9%, a difference of 0.10%), and Chilean (2.9%, a difference of 0.16%).
| Demographics | Rating | Rank | Hearing Disability |
| Liberians | 89.0 /100 | #122 | Excellent 2.8% |
| Immigrants | Zaire | 88.6 /100 | #123 | Excellent 2.9% |
| Bahamians | 88.6 /100 | #124 | Excellent 2.9% |
| Immigrants | Albania | 88.5 /100 | #125 | Excellent 2.9% |
| Immigrants | Sudan | 87.8 /100 | #126 | Excellent 2.9% |
| South American Indians | 86.9 /100 | #127 | Excellent 2.9% |
| Immigrants | Western Asia | 86.9 /100 | #128 | Excellent 2.9% |
| Immigrants | Uganda | 86.6 /100 | #129 | Excellent 2.9% |
| Immigrants | Vietnam | 86.5 /100 | #130 | Excellent 2.9% |
| Immigrants | Kenya | 86.1 /100 | #131 | Excellent 2.9% |
| Chileans | 85.8 /100 | #132 | Excellent 2.9% |
| Immigrants | Syria | 85.8 /100 | #133 | Excellent 2.9% |
| Ugandans | 85.5 /100 | #134 | Excellent 2.9% |
| Soviet Union | 84.8 /100 | #135 | Excellent 2.9% |
| Immigrants | Brazil | 84.6 /100 | #136 | Excellent 2.9% |