Moroccan vs Immigrants from Uganda Single Male Poverty
COMPARE
Moroccan
Immigrants from Uganda
Single Male Poverty
Single Male Poverty Comparison
Moroccans
Immigrants from Uganda
12.9%
SINGLE MALE POVERTY
36.8/ 100
METRIC RATING
182nd/ 347
METRIC RANK
12.6%
SINGLE MALE POVERTY
75.9/ 100
METRIC RATING
142nd/ 347
METRIC RANK
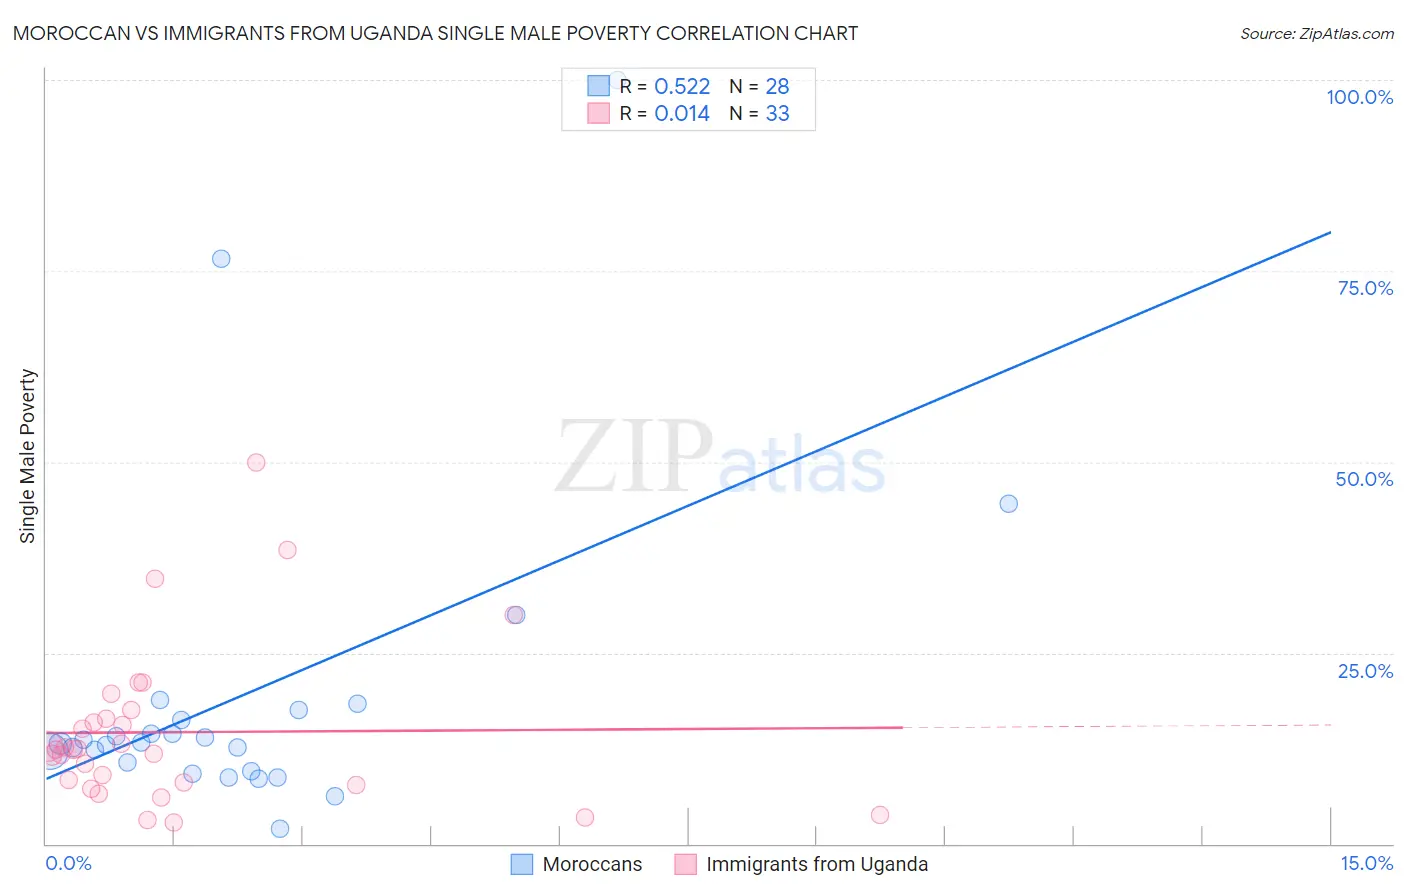
Moroccan vs Immigrants from Uganda Single Male Poverty Correlation Chart
The statistical analysis conducted on geographies consisting of 188,123,639 people shows a substantial positive correlation between the proportion of Moroccans and poverty level among single males in the United States with a correlation coefficient (R) of 0.522 and weighted average of 12.9%. Similarly, the statistical analysis conducted on geographies consisting of 119,797,773 people shows no correlation between the proportion of Immigrants from Uganda and poverty level among single males in the United States with a correlation coefficient (R) of 0.014 and weighted average of 12.6%, a difference of 2.3%.
Single Male Poverty Correlation Summary
| Measurement | Moroccan | Immigrants from Uganda |
| Minimum | 1.9% | 2.7% |
| Maximum | 100.0% | 50.0% |
| Range | 98.1% | 47.3% |
| Mean | 19.4% | 14.6% |
| Median | 13.2% | 12.4% |
| Interquartile 25% (IQ1) | 10.0% | 7.8% |
| Interquartile 75% (IQ3) | 16.9% | 17.0% |
| Interquartile Range (IQR) | 6.9% | 9.1% |
| Standard Deviation (Sample) | 21.2% | 10.5% |
| Standard Deviation (Population) | 20.8% | 10.3% |
Similar Demographics by Single Male Poverty
Demographics Similar to Moroccans by Single Male Poverty
In terms of single male poverty, the demographic groups most similar to Moroccans are Panamanian (12.9%, a difference of 0.040%), Immigrants from North America (12.9%, a difference of 0.050%), Immigrants from West Indies (12.9%, a difference of 0.22%), Israeli (12.9%, a difference of 0.23%), and Immigrants from Trinidad and Tobago (12.9%, a difference of 0.25%).
| Demographics | Rating | Rank | Single Male Poverty |
| Croatians | 48.9 /100 | #175 | Average 12.8% |
| Syrians | 48.4 /100 | #176 | Average 12.8% |
| Immigrants | Canada | 44.8 /100 | #177 | Average 12.8% |
| Immigrants | Switzerland | 43.1 /100 | #178 | Average 12.8% |
| Israelis | 41.0 /100 | #179 | Average 12.9% |
| Immigrants | North America | 37.7 /100 | #180 | Fair 12.9% |
| Panamanians | 37.6 /100 | #181 | Fair 12.9% |
| Moroccans | 36.8 /100 | #182 | Fair 12.9% |
| Immigrants | West Indies | 33.0 /100 | #183 | Fair 12.9% |
| Immigrants | Trinidad and Tobago | 32.5 /100 | #184 | Fair 12.9% |
| Norwegians | 32.0 /100 | #185 | Fair 12.9% |
| Nigerians | 31.9 /100 | #186 | Fair 12.9% |
| Immigrants | Kuwait | 31.9 /100 | #187 | Fair 12.9% |
| Macedonians | 31.5 /100 | #188 | Fair 12.9% |
| Portuguese | 30.2 /100 | #189 | Fair 12.9% |
Demographics Similar to Immigrants from Uganda by Single Male Poverty
In terms of single male poverty, the demographic groups most similar to Immigrants from Uganda are Okinawan (12.6%, a difference of 0.0%), Immigrants from France (12.6%, a difference of 0.010%), Hawaiian (12.6%, a difference of 0.060%), Immigrants from Lebanon (12.6%, a difference of 0.070%), and Native Hawaiian (12.6%, a difference of 0.070%).
| Demographics | Rating | Rank | Single Male Poverty |
| Immigrants | Costa Rica | 81.9 /100 | #135 | Excellent 12.5% |
| Immigrants | Austria | 81.9 /100 | #136 | Excellent 12.5% |
| Ukrainians | 80.7 /100 | #137 | Excellent 12.6% |
| Immigrants | El Salvador | 80.0 /100 | #138 | Excellent 12.6% |
| Cubans | 79.9 /100 | #139 | Good 12.6% |
| Immigrants | Zimbabwe | 78.0 /100 | #140 | Good 12.6% |
| Okinawans | 75.9 /100 | #141 | Good 12.6% |
| Immigrants | Uganda | 75.9 /100 | #142 | Good 12.6% |
| Immigrants | France | 75.8 /100 | #143 | Good 12.6% |
| Hawaiians | 75.1 /100 | #144 | Good 12.6% |
| Immigrants | Lebanon | 75.0 /100 | #145 | Good 12.6% |
| Native Hawaiians | 75.0 /100 | #146 | Good 12.6% |
| Malaysians | 74.8 /100 | #147 | Good 12.6% |
| Yugoslavians | 73.9 /100 | #148 | Good 12.6% |
| Sierra Leoneans | 73.0 /100 | #149 | Good 12.6% |