Immigrants from Croatia vs Immigrants from Poland Female Poverty
COMPARE
Immigrants from Croatia
Immigrants from Poland
Female Poverty
Female Poverty Comparison
Immigrants from Croatia
Immigrants from Poland
12.0%
FEMALE POVERTY
98.7/ 100
METRIC RATING
52nd/ 347
METRIC RANK
11.8%
FEMALE POVERTY
99.3/ 100
METRIC RATING
39th/ 347
METRIC RANK
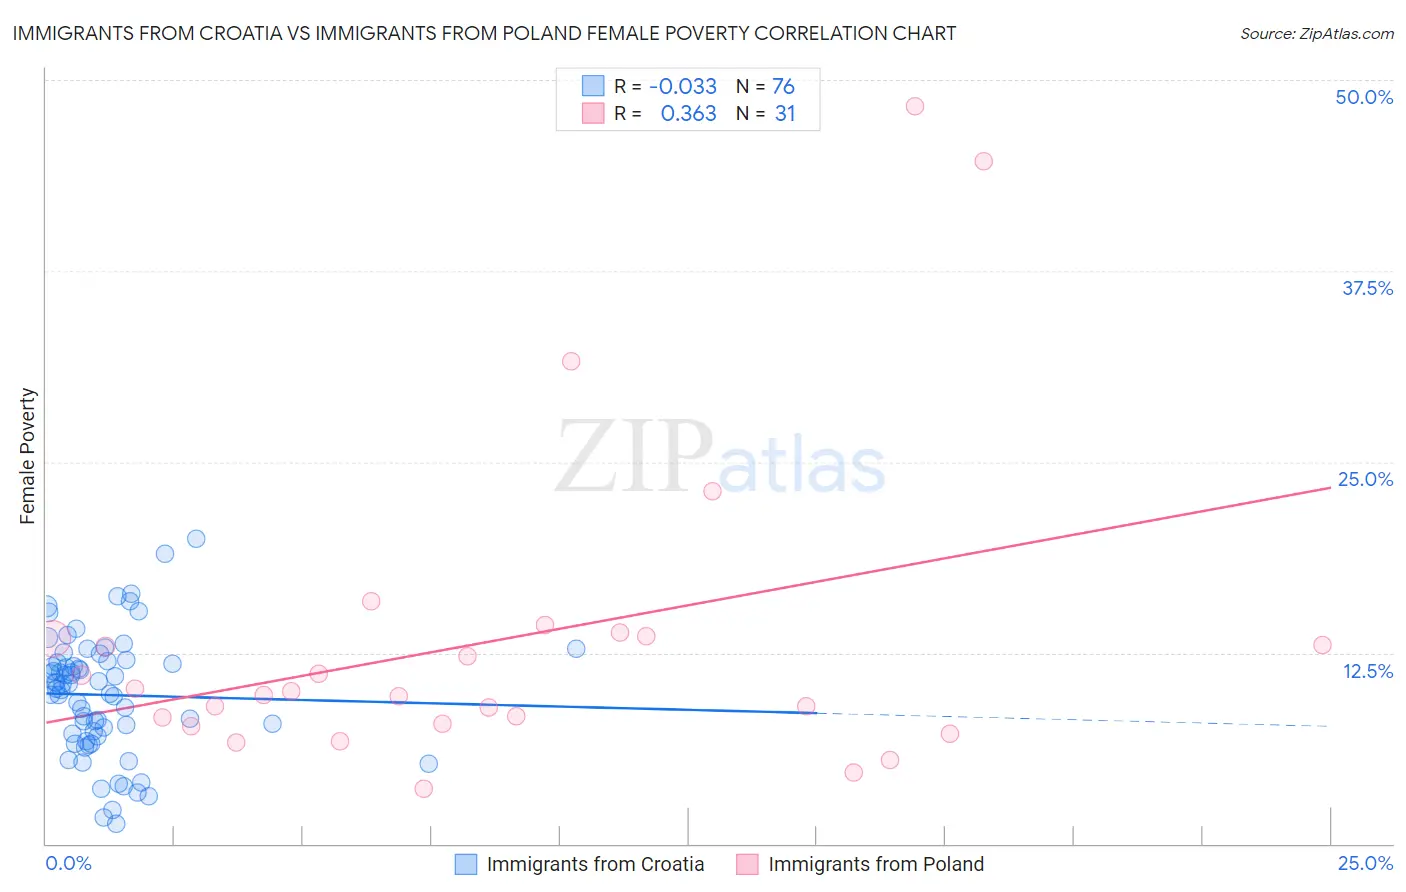
Immigrants from Croatia vs Immigrants from Poland Female Poverty Correlation Chart
The statistical analysis conducted on geographies consisting of 132,555,435 people shows no correlation between the proportion of Immigrants from Croatia and poverty level among females in the United States with a correlation coefficient (R) of -0.033 and weighted average of 12.0%. Similarly, the statistical analysis conducted on geographies consisting of 304,710,065 people shows a mild positive correlation between the proportion of Immigrants from Poland and poverty level among females in the United States with a correlation coefficient (R) of 0.363 and weighted average of 11.8%, a difference of 1.6%.
Female Poverty Correlation Summary
| Measurement | Immigrants from Croatia | Immigrants from Poland |
| Minimum | 1.3% | 3.6% |
| Maximum | 20.0% | 48.3% |
| Range | 18.7% | 44.7% |
| Mean | 9.7% | 13.3% |
| Median | 10.3% | 10.0% |
| Interquartile 25% (IQ1) | 7.1% | 7.9% |
| Interquartile 75% (IQ3) | 11.9% | 13.6% |
| Interquartile Range (IQR) | 4.8% | 5.7% |
| Standard Deviation (Sample) | 3.9% | 10.4% |
| Standard Deviation (Population) | 3.9% | 10.2% |
Demographics Similar to Immigrants from Croatia and Immigrants from Poland by Female Poverty
In terms of female poverty, the demographic groups most similar to Immigrants from Croatia are Immigrants from Austria (12.0%, a difference of 0.010%), Immigrants from Philippines (12.1%, a difference of 0.15%), Immigrants from Bulgaria (12.0%, a difference of 0.31%), Immigrants from Sri Lanka (12.1%, a difference of 0.50%), and Slovene (12.0%, a difference of 0.52%). Similarly, the demographic groups most similar to Immigrants from Poland are Macedonian (11.8%, a difference of 0.050%), Russian (11.8%, a difference of 0.21%), Immigrants from Greece (11.8%, a difference of 0.22%), Czech (11.9%, a difference of 0.23%), and Immigrants from Moldova (11.9%, a difference of 0.23%).
| Demographics | Rating | Rank | Female Poverty |
| Immigrants | Iran | 99.4 /100 | #35 | Exceptional 11.8% |
| Immigrants | Pakistan | 99.4 /100 | #36 | Exceptional 11.8% |
| Immigrants | Greece | 99.3 /100 | #37 | Exceptional 11.8% |
| Russians | 99.3 /100 | #38 | Exceptional 11.8% |
| Immigrants | Poland | 99.3 /100 | #39 | Exceptional 11.8% |
| Macedonians | 99.3 /100 | #40 | Exceptional 11.8% |
| Czechs | 99.2 /100 | #41 | Exceptional 11.9% |
| Immigrants | Moldova | 99.2 /100 | #42 | Exceptional 11.9% |
| Koreans | 99.2 /100 | #43 | Exceptional 11.9% |
| Tongans | 99.2 /100 | #44 | Exceptional 11.9% |
| Immigrants | Czechoslovakia | 99.2 /100 | #45 | Exceptional 11.9% |
| Turks | 99.2 /100 | #46 | Exceptional 11.9% |
| Asians | 99.1 /100 | #47 | Exceptional 11.9% |
| Immigrants | Japan | 99.0 /100 | #48 | Exceptional 11.9% |
| Immigrants | Romania | 99.0 /100 | #49 | Exceptional 12.0% |
| Slovenes | 98.9 /100 | #50 | Exceptional 12.0% |
| Immigrants | Bulgaria | 98.9 /100 | #51 | Exceptional 12.0% |
| Immigrants | Croatia | 98.7 /100 | #52 | Exceptional 12.0% |
| Immigrants | Austria | 98.7 /100 | #53 | Exceptional 12.0% |
| Immigrants | Philippines | 98.7 /100 | #54 | Exceptional 12.1% |
| Immigrants | Sri Lanka | 98.5 /100 | #55 | Exceptional 12.1% |