Immigrants from the Azores vs Immigrants from Poland Female Poverty
COMPARE
Immigrants from the Azores
Immigrants from Poland
Female Poverty
Female Poverty Comparison
Immigrants from the Azores
Immigrants from Poland
14.2%
FEMALE POVERTY
7.9/ 100
METRIC RATING
208th/ 347
METRIC RANK
11.8%
FEMALE POVERTY
99.3/ 100
METRIC RATING
39th/ 347
METRIC RANK
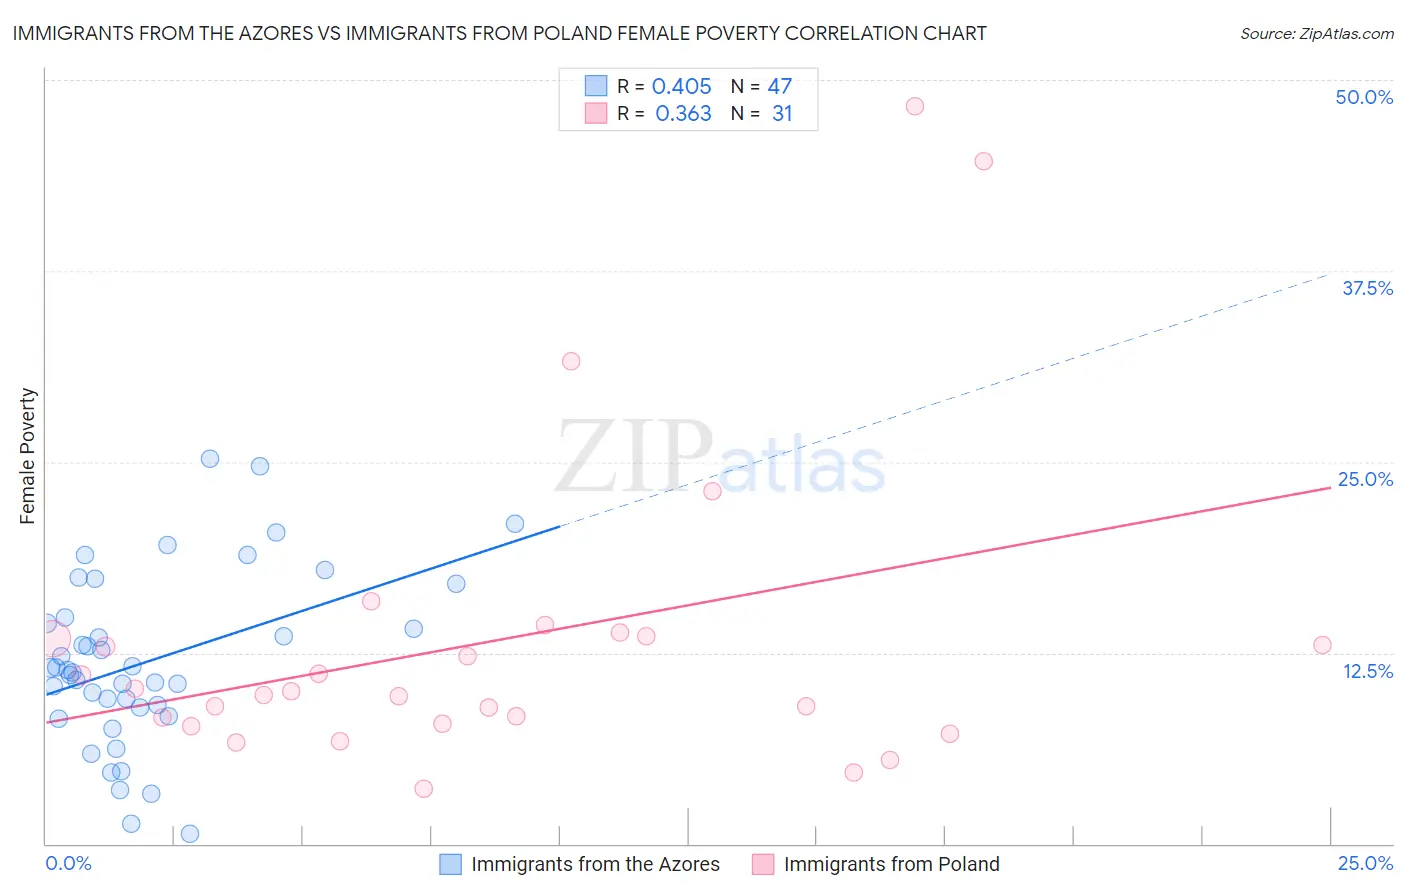
Immigrants from the Azores vs Immigrants from Poland Female Poverty Correlation Chart
The statistical analysis conducted on geographies consisting of 46,244,959 people shows a moderate positive correlation between the proportion of Immigrants from the Azores and poverty level among females in the United States with a correlation coefficient (R) of 0.405 and weighted average of 14.2%. Similarly, the statistical analysis conducted on geographies consisting of 304,710,065 people shows a mild positive correlation between the proportion of Immigrants from Poland and poverty level among females in the United States with a correlation coefficient (R) of 0.363 and weighted average of 11.8%, a difference of 20.2%.
Female Poverty Correlation Summary
| Measurement | Immigrants from the Azores | Immigrants from Poland |
| Minimum | 0.65% | 3.6% |
| Maximum | 25.2% | 48.3% |
| Range | 24.5% | 44.7% |
| Mean | 12.0% | 13.3% |
| Median | 11.3% | 10.0% |
| Interquartile 25% (IQ1) | 8.9% | 7.9% |
| Interquartile 75% (IQ3) | 14.8% | 13.6% |
| Interquartile Range (IQR) | 5.9% | 5.7% |
| Standard Deviation (Sample) | 5.6% | 10.4% |
| Standard Deviation (Population) | 5.6% | 10.2% |
Similar Demographics by Female Poverty
Demographics Similar to Immigrants from the Azores by Female Poverty
In terms of female poverty, the demographic groups most similar to Immigrants from the Azores are Panamanian (14.2%, a difference of 0.060%), Malaysian (14.3%, a difference of 0.15%), Moroccan (14.3%, a difference of 0.23%), Immigrants from Eastern Africa (14.2%, a difference of 0.34%), and Bermudan (14.4%, a difference of 0.86%).
| Demographics | Rating | Rank | Female Poverty |
| Immigrants | Kenya | 21.1 /100 | #201 | Fair 13.9% |
| Hmong | 21.1 /100 | #202 | Fair 13.9% |
| Immigrants | Western Asia | 20.7 /100 | #203 | Fair 13.9% |
| Spaniards | 18.9 /100 | #204 | Poor 13.9% |
| Ugandans | 15.4 /100 | #205 | Poor 14.0% |
| Immigrants | Uruguay | 14.0 /100 | #206 | Poor 14.0% |
| Immigrants | Eastern Africa | 9.0 /100 | #207 | Tragic 14.2% |
| Immigrants | Azores | 7.9 /100 | #208 | Tragic 14.2% |
| Panamanians | 7.7 /100 | #209 | Tragic 14.2% |
| Malaysians | 7.4 /100 | #210 | Tragic 14.3% |
| Moroccans | 7.2 /100 | #211 | Tragic 14.3% |
| Bermudans | 5.5 /100 | #212 | Tragic 14.4% |
| Alaskan Athabascans | 5.3 /100 | #213 | Tragic 14.4% |
| Marshallese | 5.0 /100 | #214 | Tragic 14.4% |
| Immigrants | Panama | 4.7 /100 | #215 | Tragic 14.4% |
Demographics Similar to Immigrants from Poland by Female Poverty
In terms of female poverty, the demographic groups most similar to Immigrants from Poland are Macedonian (11.8%, a difference of 0.050%), Russian (11.8%, a difference of 0.21%), Immigrants from Greece (11.8%, a difference of 0.22%), Czech (11.9%, a difference of 0.23%), and Immigrants from Moldova (11.9%, a difference of 0.23%).
| Demographics | Rating | Rank | Female Poverty |
| Danes | 99.5 /100 | #32 | Exceptional 11.7% |
| Cypriots | 99.5 /100 | #33 | Exceptional 11.8% |
| Immigrants | Singapore | 99.4 /100 | #34 | Exceptional 11.8% |
| Immigrants | Iran | 99.4 /100 | #35 | Exceptional 11.8% |
| Immigrants | Pakistan | 99.4 /100 | #36 | Exceptional 11.8% |
| Immigrants | Greece | 99.3 /100 | #37 | Exceptional 11.8% |
| Russians | 99.3 /100 | #38 | Exceptional 11.8% |
| Immigrants | Poland | 99.3 /100 | #39 | Exceptional 11.8% |
| Macedonians | 99.3 /100 | #40 | Exceptional 11.8% |
| Czechs | 99.2 /100 | #41 | Exceptional 11.9% |
| Immigrants | Moldova | 99.2 /100 | #42 | Exceptional 11.9% |
| Koreans | 99.2 /100 | #43 | Exceptional 11.9% |
| Tongans | 99.2 /100 | #44 | Exceptional 11.9% |
| Immigrants | Czechoslovakia | 99.2 /100 | #45 | Exceptional 11.9% |
| Turks | 99.2 /100 | #46 | Exceptional 11.9% |