Bahamian vs Immigrants from Switzerland Single Female Poverty
COMPARE
Bahamian
Immigrants from Switzerland
Single Female Poverty
Single Female Poverty Comparison
Bahamians
Immigrants from Switzerland
22.7%
SINGLE FEMALE POVERTY
0.6/ 100
METRIC RATING
258th/ 347
METRIC RANK
20.0%
SINGLE FEMALE POVERTY
95.1/ 100
METRIC RATING
121st/ 347
METRIC RANK
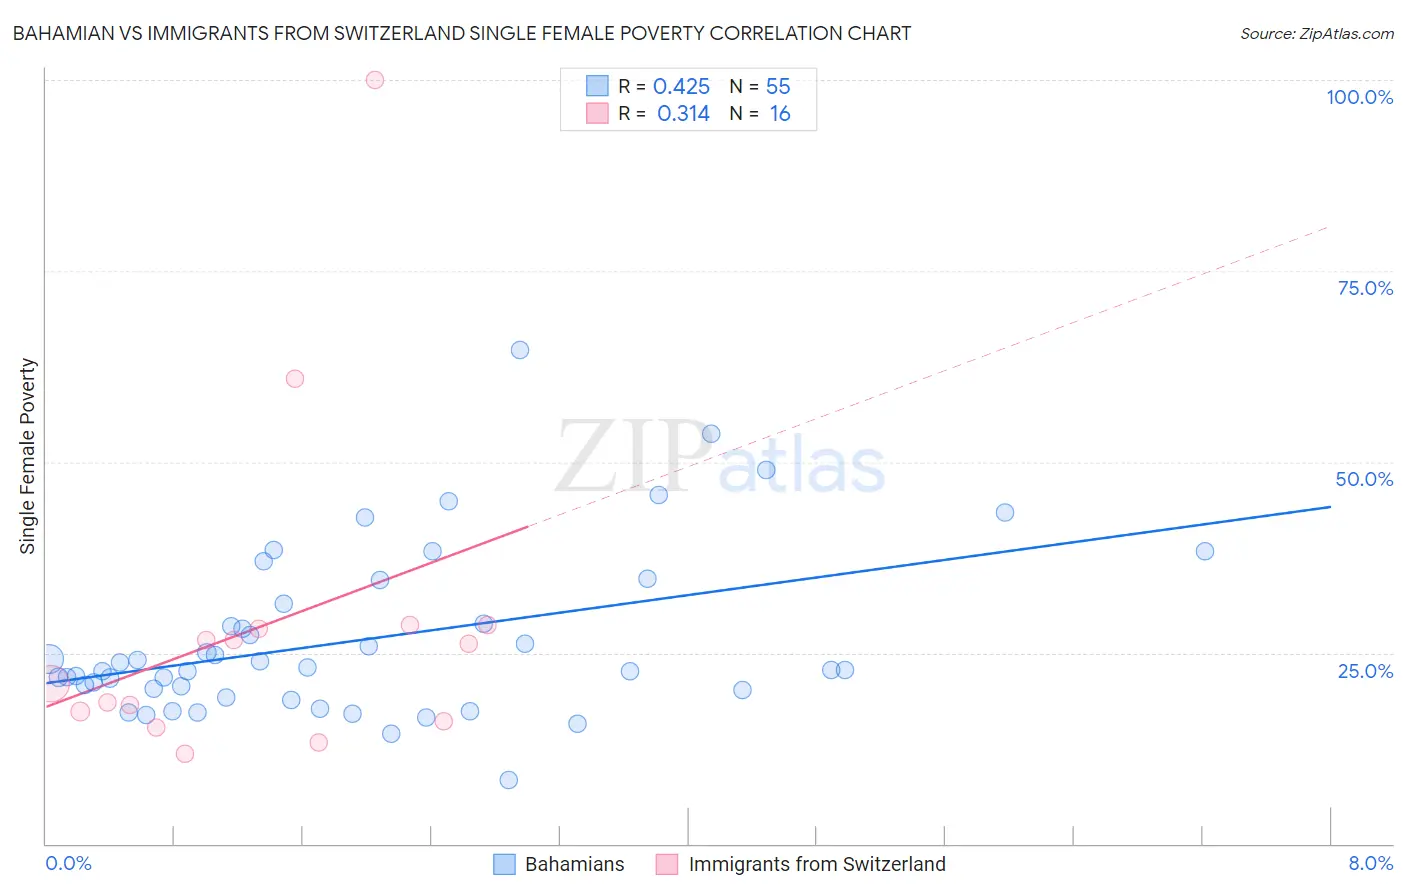
Bahamian vs Immigrants from Switzerland Single Female Poverty Correlation Chart
The statistical analysis conducted on geographies consisting of 112,361,785 people shows a moderate positive correlation between the proportion of Bahamians and poverty level among single females in the United States with a correlation coefficient (R) of 0.425 and weighted average of 22.7%. Similarly, the statistical analysis conducted on geographies consisting of 146,751,859 people shows a mild positive correlation between the proportion of Immigrants from Switzerland and poverty level among single females in the United States with a correlation coefficient (R) of 0.314 and weighted average of 20.0%, a difference of 13.1%.
Single Female Poverty Correlation Summary
| Measurement | Bahamian | Immigrants from Switzerland |
| Minimum | 8.3% | 11.7% |
| Maximum | 64.6% | 100.0% |
| Range | 56.3% | 88.3% |
| Mean | 26.7% | 28.5% |
| Median | 22.7% | 23.5% |
| Interquartile 25% (IQ1) | 20.2% | 16.6% |
| Interquartile 75% (IQ3) | 31.5% | 28.3% |
| Interquartile Range (IQR) | 11.3% | 11.7% |
| Standard Deviation (Sample) | 10.9% | 22.2% |
| Standard Deviation (Population) | 10.8% | 21.5% |
Similar Demographics by Single Female Poverty
Demographics Similar to Bahamians by Single Female Poverty
In terms of single female poverty, the demographic groups most similar to Bahamians are White/Caucasian (22.7%, a difference of 0.14%), Sudanese (22.6%, a difference of 0.20%), Celtic (22.7%, a difference of 0.21%), Immigrants from Belize (22.6%, a difference of 0.34%), and Immigrants from Cabo Verde (22.8%, a difference of 0.48%).
| Demographics | Rating | Rank | Single Female Poverty |
| Immigrants | West Indies | 1.0 /100 | #251 | Tragic 22.5% |
| Delaware | 1.0 /100 | #252 | Tragic 22.5% |
| Immigrants | Liberia | 0.9 /100 | #253 | Tragic 22.5% |
| Immigrants | Burma/Myanmar | 0.8 /100 | #254 | Tragic 22.6% |
| Immigrants | Sudan | 0.8 /100 | #255 | Tragic 22.6% |
| Immigrants | Belize | 0.8 /100 | #256 | Tragic 22.6% |
| Sudanese | 0.7 /100 | #257 | Tragic 22.6% |
| Bahamians | 0.6 /100 | #258 | Tragic 22.7% |
| Whites/Caucasians | 0.6 /100 | #259 | Tragic 22.7% |
| Celtics | 0.5 /100 | #260 | Tragic 22.7% |
| Immigrants | Cabo Verde | 0.4 /100 | #261 | Tragic 22.8% |
| British West Indians | 0.4 /100 | #262 | Tragic 22.8% |
| Scotch-Irish | 0.3 /100 | #263 | Tragic 22.9% |
| Immigrants | Laos | 0.3 /100 | #264 | Tragic 22.9% |
| Central Americans | 0.2 /100 | #265 | Tragic 23.0% |
Demographics Similar to Immigrants from Switzerland by Single Female Poverty
In terms of single female poverty, the demographic groups most similar to Immigrants from Switzerland are South American (20.0%, a difference of 0.030%), Immigrants from South America (20.0%, a difference of 0.030%), Immigrants from Afghanistan (20.0%, a difference of 0.13%), Immigrants from Ethiopia (20.0%, a difference of 0.13%), and Polish (20.0%, a difference of 0.20%).
| Demographics | Rating | Rank | Single Female Poverty |
| Immigrants | Colombia | 95.9 /100 | #114 | Exceptional 20.0% |
| Immigrants | Northern Africa | 95.8 /100 | #115 | Exceptional 20.0% |
| Immigrants | Kazakhstan | 95.7 /100 | #116 | Exceptional 20.0% |
| Poles | 95.6 /100 | #117 | Exceptional 20.0% |
| Immigrants | Afghanistan | 95.4 /100 | #118 | Exceptional 20.0% |
| Immigrants | Ethiopia | 95.4 /100 | #119 | Exceptional 20.0% |
| South Americans | 95.1 /100 | #120 | Exceptional 20.0% |
| Immigrants | Switzerland | 95.1 /100 | #121 | Exceptional 20.0% |
| Immigrants | South America | 95.0 /100 | #122 | Exceptional 20.0% |
| Brazilians | 94.4 /100 | #123 | Exceptional 20.1% |
| Immigrants | Chile | 94.3 /100 | #124 | Exceptional 20.1% |
| Immigrants | South Africa | 93.9 /100 | #125 | Exceptional 20.1% |
| Serbians | 93.3 /100 | #126 | Exceptional 20.1% |
| Mongolians | 93.2 /100 | #127 | Exceptional 20.2% |
| Immigrants | Spain | 92.7 /100 | #128 | Exceptional 20.2% |